Home » speedtest » Recent Articles:

Cisco Releases New Broadband Rankings: U.S. and Canada Not In The Top-10, Qatar Is

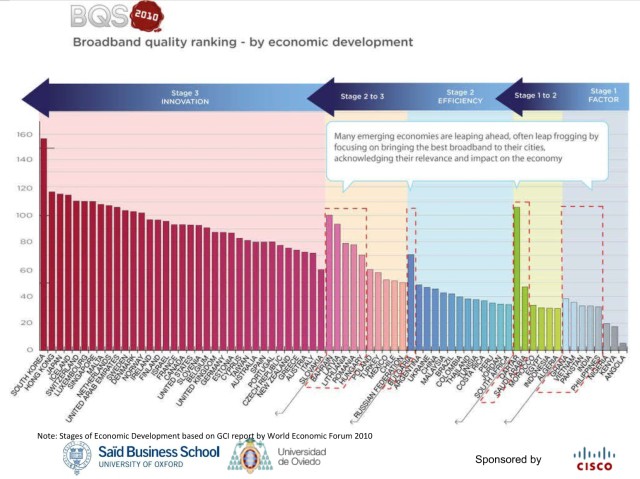
Cisco has released the results of the third annual study from the Saïd Business School at Oxford University, which looks at broadband quality in 72 countries and 239 cities around the world.  The results are an embarrassment to much of North America’s broadband.

Using data from 40 million real-life broadband quality tests conducted in May-June of 2010 on the Internet speed testing site, Speedtest.net, the researchers were able to generally evaluate broadband conditions in the 72 countries which generated enough tests to provide useful results.

Although these kinds of studies often end up indirectly promoting Cisco’s own products (which they’d argue go hand-in-hand with broadband improvement), the findings highlight the very real problem that most aggressive broadband development is taking place outside of North America.  Here at home, reduced investment and foot-dragging has kept growth in check, even as prices continue to rise.

Based on the findings, the countries with the most sophisticated and advanced broadband networks are:

Broadband leadership table (top 10):Ranking Broadband Leadership 2010
1 South Korea
2 Hong Kong
3 Japan
4 Iceland
5 Switzerland. Luxembourg, Singapore (tie)
6 Malta
7 Netherlands
8 United Arab Emirates, Qatar (tie)
9 Sweden
10 Denmark

While the United States and Canada both languish in 15th place, broadband in South Korea has gone from excellent to outstanding as it continues aggressive, almost revolutionary improvements in service and speed:

  • South Korea tops the broadband leadership ranking for the second year in a row;
  • Broadband quality in South Korea is ranked the highest and has set a new benchmark for the world;
  • Average download throughput is 33.5 Mbps, an increase of 55% from 2009, average upload throughput is 17 Mbps, an increase of 430%, and average latency is 47ms, an improvement of 35% vs. 2009 figure;
  • South Korea has achieved 100% broadband penetration.

Cisco’s study found North America is in peril of falling even further behind because providers are trying to incrementally upgrade inferior, obsolete copper-wire phone networks on the cheap instead of replacing them.

As long as providers in the United States and Canada maintain a Dollar Store-mentality towards broadband improvement, both countries will increasingly fall further and further behind countries many Americans couldn’t find on a map.

Developing economies, especially in eastern Europe, are poised to leapfrog over North America and potentially become new powerhouses in the digital global economy of the future.  Among the nations on the verge of blowing past the United States and Canada: Lithuania, Latvia, Bulgaria, Romania, the Czech Republic and Hungary.

Welcome to the 500GB Broadband Economy

Cisco’s study also includes some important findings about data consumption that expose North American broadband providers who support Internet Overcharging schemes as direct threats to our economic future in a knowledge economy:

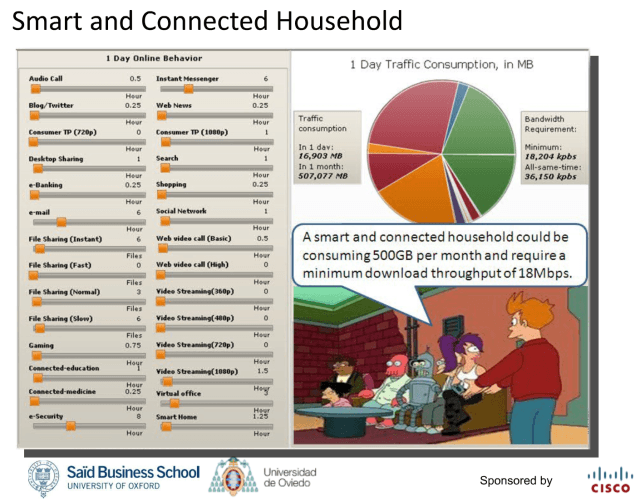
The study assessed the average consumption of different household segments and found major differences between basic-digital homes and smart and connected homes:

  • Basic digital homes which mainly use the web for simple-quality requirement applications such as web browsing, instant messaging and social networking, consume about 20 GB per month;
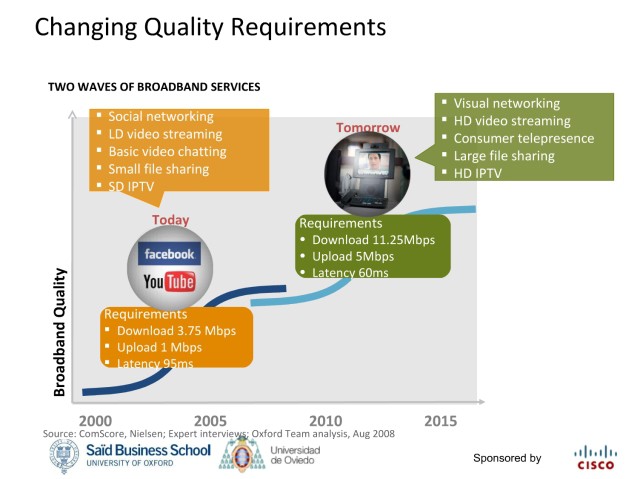
  • Smart and connected households, who would use the web for high definition video communication, high definition entertainment, tele-education or telemedicine, home security and others, can easily consume 500 GB per month and require an assured bandwidth of 18 Mbps.

Under these terms, Canada’s digital economy is already destined to fail because virtually every provider in the country limits broadband consumption to levels far below that required by “smart and connected households.”  In the United States, some providers have suggested as little as 5GB would represent “enough usage” under residential broadband accounts.  The nation’s largest cable company, Comcast, limits consumption to half the amount required.  Those advocating unlimited broadband or far higher limits are accused of being “bandwidth hogs” or pirates by many of these providers and their dollar-a-holler friends.

World leaders in broadband have some things in common: availability of inexpensive, unlimited broadband delivering fiber-fast speeds.  Those falling behind or at the bottom are raising broadband prices, putting limits on consumption and delivering slow broadband speeds that would draw laughter in countries as diverse as Japan, Sweden, and the United Arab Emirates.

Is Your Internet Provider Charging You for Speeds It Doesn’t Deliver? Find Out!

Phillip Dampier October 13, 2010 Broadband Speed, Competition, Consumer News, Video Comments Off on Is Your Internet Provider Charging You for Speeds It Doesn’t Deliver? Find Out!

You paid for "lightning fast" speed, but are you actually getting it? Find out!

In areas where limited competition between broadband providers has broken out, consumers are discovering their local providers advertising faster, higher priced tiers of Internet service.  But do you really get the speeds you are paying for?

There are a number of factors that can impact your speed — the quality of the lines to your home, whether you are accessing the Internet through a wireless connection, and how much congestion your provider copes with during peak usage times.  Here are some tips to consider:

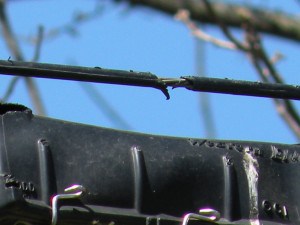
If your speeds are simply awful — nearing dial-up at times —  especially when the weather is poor outside, you should first suspect a problem with your connection.  Call your provider and request a line test to determine if there is an obvious fault with the lines running to your home or business.  The usual culprits are cracked cable fittings, worn out insulation, water getting into the wiring, or squirrels that have used your phone or cable line as a toothpick.  If the line test is not definitive, request a service call to check your lines.  Phone cables are especially prone to water damage, often inside terminal boxes located well off your property.  Cable TV lines suffer from corrosion, insulation that has fallen away or cracked, or fittings that need replacement.  If critters have chewed through the outer cable, you will often also see the results on your television with a downright lousy picture.  The biggest problems always seem to appear in the spring and fall during major climate transitions.

If you notice speeds are much slower during the early evening and weekends and you are on a cable connection, your cable company has probably oversold service in your neighborhood and too many users are trying to share the line at the same time.  Cable companies can divide up the traffic by splitting the neighborhood’s connection back to the cable company in half.  The upgrade is usually done at a box or facility somewhere in the neighborhood, not at your home.  If this prime time slowdown occurs on a DSL or fiber connection, chances are the provider doesn’t have a wide enough pipeline to the Internet to accommodate customer demand in that town or city.

A squirrel's favorite chew toy may be your broadband cable or phone line.

Also remember that DSL connections from the phone company are sensitive to the distance between your home and the phone company’s central office.  Don’t pay for higher speed tiers of service if your phone line simply refuses to support those speeds.  Downgrade your service to a speed level you can realistically expect to receive in your home.

If you access the Internet over a wireless connection from a router, a major speed logjam can occur if your Wi-Fi signal faces interference from neighbors sharing the same wireless channel.  Sometimes just running a microwave oven can obliterate certain wireless connections or significantly slow them down.  If your signal strength meter shows poor or fair reception, try reorienting your wireless router.  The higher you can place the router and keep it free of obstructions the better.  Walls, floors, and even metal filing cabinets can degrade wireless signals.  Many wireless routers have two antennas.  Try orienting one antenna vertically and the other horizontally and see if it makes a difference.  Sometimes moving a router across the room can make a significant difference.  You can also try changing wireless channels if you routinely see a large number of neighbors’ Wi-Fi connections all piling on the same channel you use.

The best way to gauge what kind of Internet speeds you are getting is to perform a free speed test at different times of the day.  Your service provider may have its own test website to visit (try Googling the name of your provider, your nearest city and “speed test” in a one sentence search).  Broadband Reports has several different speed tests to try as well.

If you are not getting what you are paying for, be sure to complain and get some money back.

[flv width=”480″ height=”380″]http://www.phillipdampier.com/video/KNXV Phoenix Qwest and Cox may charge your for faster Internet speed, but is your broadband really that fast 8-24-10.flv[/flv]

KNXV-TV in Phoenix explains how to make sure you are getting the Internet speeds you are paying for with some free speed test websites.  (2 minutes)

NY Gets Broadband Mapping Grant: $6.3 Million Is a Lot of Scratch for a Map

New York State has won $6.3 million in federal stimulus grant money to draw a map of broadband availability in the state.  That’s a lot of money to draw a map.

Hopefully it will deliver a better result than the map that’s already online: inaccurate, slow to load, incomplete, and doesn’t play well with some browsers.

The NY State Office of Cyber Security is responsible for administering the project, which is an improvement over provider-infested (Well)-Connected Nation that draws maps for some other states.  The one developed for Texas was so bad, it became fodder in an election campaign to ridicule the man who approved it.

Theoretically, people can enter a street address and see a list of broadband providers who offer service in their neighborhoods, including the types of service and advertised service speeds.  But most of the data is voluntarily provided by the service providers themselves, and we know they have no reason to exaggerate, right?

Here at Stop the Cap! HQ, we decided to give the map a test run to see what it claimed was available here in the town of Brighton, a suburb just southeast of the city of Rochester, N.Y.:

NY State Broadband Availability Map for Zip Code 14618 - Brighton, N.Y. (click to enlarge)

Just to assist readers, the orange color represents fiber access, the blue represents cable broadband, and the pink-salmon represents DSL.  The results are actually an overlay of various service providers.  Time Warner Cable service is available throughout the 14618 zip code and the pockets of fiber are targeting business parks and medical offices.  These results appear generally accurate.  What is missing is an accurate depiction of DSL service.  That may be because Frontier Communications, the local telephone company, is not listed as a participant in the mapping project.  While DSL performs dreadfully in a number of areas in this zip code, it is generally available for most residents.

The results for wireless providers were a real hoot (speed results are for downstream and upstream speeds, respectively):

AT&T Mobility Mobile 1.5 mbps – 3 mbps 768 kbps – 1.5 mbps
Leap Wireless International Mobile 768 kbps – 1.5 mbps 768 kbps – 1.5 mbps
Sprint Nextel Mobile 768 kbps – 1.5 mbps 200 kbps -768 kbps
Verizon Wireless Mobile not reported not reported

(Note to AT&T: In your dreams.)

Only one of these results represent actual speeds seen from wireless broadband providers in this neighborhood, and we’ve tested most of them.  Sprint Nextel can manage 768kbps connections on its 3G network, and even faster speeds on its 4G network.  AT&T’s claimed 1.5-3Mbps is laughable.  Leap Wireless (a/k/a Cricket) delivers an average of 500-600kbps, with occasional bursts of 700kbps in this area.  Verizon typically has the best coverage but there is no data to compare.

The mapping folks have a lot of work to do to map actual wireless speeds around the state, not simply take the word of providers about the speeds they deliver.  New Yorkers can take a speed test and presumably help create that database.  The link is available at the top right of this story.

Ostensibly the map will allow the state to identify areas where high-speed Internet access is lacking so those gaps in coverage can be addressed. Gov. David Paterson has made a priority of extending affordable high-speed Internet access to all New Yorkers.  How a state with a budget deficit that approached $9.2 billion this summer can map its way towards that may require another grant.

Thanks to Stop the Cap! reader Paul for letting us know.

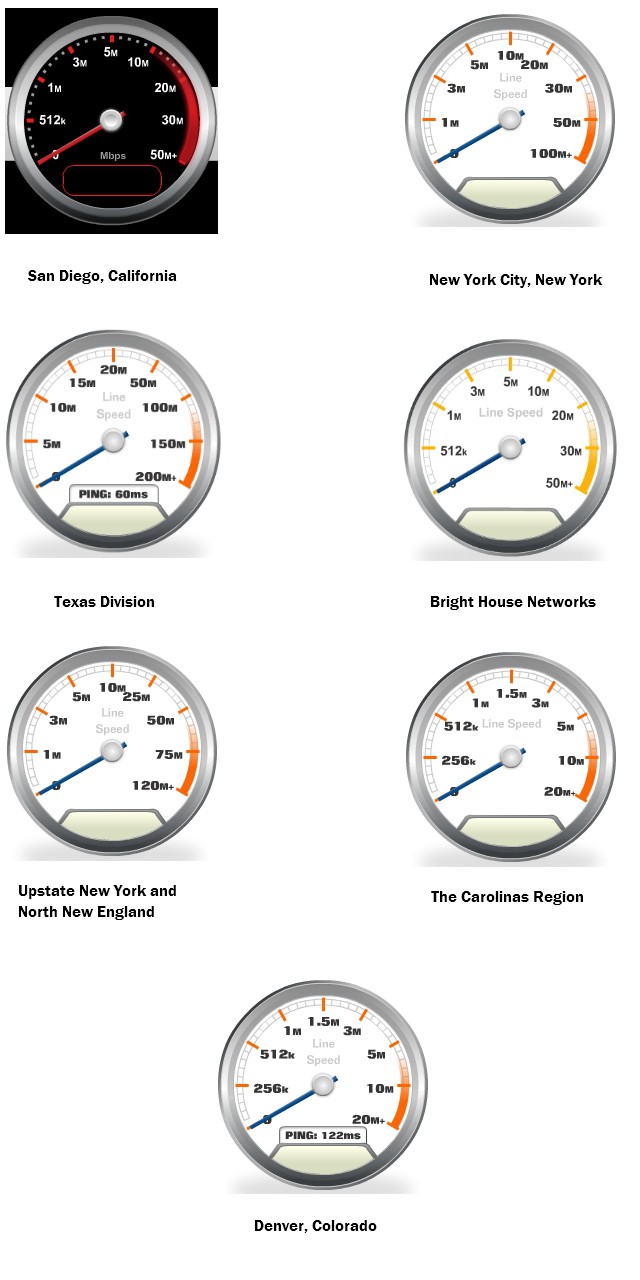
Does Time Warner Cable’s Speedtest Gauge Provide Hints About Speed Upgrades?

Phillip Dampier February 22, 2010 Broadband Speed 3 Comments

Stop the Cap! reader Brian thought he noticed a change in Time Warner Cable’s speedtest website for upstate New York residents — he thought the top speed on the gauge may have increased.  At the same time, a few readers on the Broadband Reports Road Runner forum wondered if a change in the Texas division’s speedtest gauge meant DOCSIS 3 upgrades were headed their way.

Perhaps, but Time Warner Cable’s speedtest gauges probably aren’t a guaranteed indicator of an imminent upgrade.  The one for western New York has shown a maximum speed of 120Mbps for months now, but there’s no evidence every city covered by it will soon have up to 100Mbps service.

A quick survey of Road Runner speedtest sites show a remarkable variation:

Search This Site:

Contributions:

Recent Comments:

Your Account:

Stop the Cap!