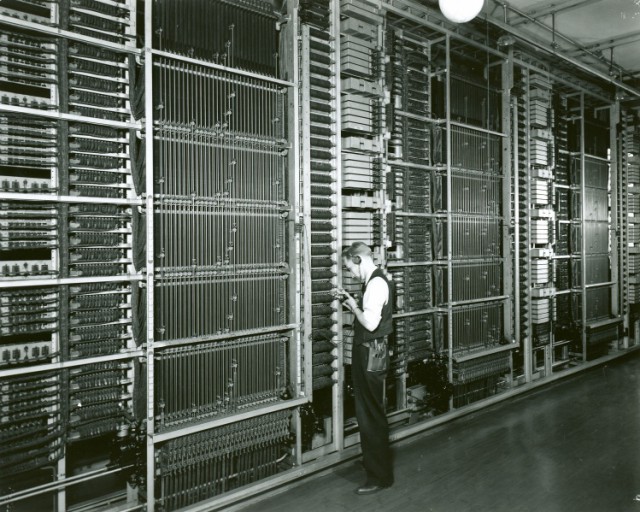
A panel electromechanical switch similar to those in use in New York until the 1970s. They were installed in the 1920s.
As late as the 1970s, New York Telephone (today Verizon) was still maintaining electromechanical panel switches in its telephone exchanges that were developed in the middle of World War I and installed in Manhattan between 1922-1930. Reliance on infrastructure 40-50 years old is nothing new for telephone companies across North America. A Verizon technician in New York City is just as likely to descend into tunnels constructed well before they were born as is a Bell technician in Toronto.
Slightly marring last week’s ambitious announcement Bell (Canada) was going to commence an upgrade to fiber to the home service across the Greater Toronto Area came word from a frank Bell technician in attendance who predicted Bell’s plans were likely to run into problems as workers deal with aging copper infrastructure originally installed by their fathers and grandfathers decades earlier.
The technician said some of the underground conduits he was working in just weeks earlier in Toronto’s downtown core were “easily 60-70 years old” and the existing optical fiber cables running through some of them were installed in the mid-1980s.
At least that conduit contained fiber. In many other cities, copper infrastructure from the 1960s-1980s is still in service, performing unevenly in some cases and not much at all in others.
Earlier this year, several hundred Verizon customers were without telephone service for weeks because of water intrusion into copper telephone cables, possibly amplified by the corrosive road salt dumped on New York streets to combat a severe winter. Verizon’s copper was down and out while its fiber optic network was unaffected. On the west coast, AT&T deals with similar outages caused by flooding. If that doesn’t affect service, copper theft might.

Fiber optic cable
Telephone companies fight to get their money’s worth from infrastructure, no matter how old it is. Western Electric first envisioned the panel switches used in New York City telephone exchanges until the end of the Carter Administration back in 1916. It was all a part of AT&T’s revolutionary plan to move to subscriber-dialed calls, ending an era of asking an operator to connect you to another customer.
AT&T engineer W.G. Blauvelt wrote the plan that moved New York to fully automatic dialing. By 1930, every telephone exchange in Manhattan was served by a panel switch that allowed customers to dial numbers by themselves. But Blauvelt could not have envisioned that equipment would still be in use fifty years later.
As demand for telephones grew, the phone company did not expand its network of panel switches, which were huge – occupying entire buildings – loud, and very costly to maintain. It did not replace them either. Instead, newer exchanges got the latest equipment, starting with more modern Crossbar #1 switches in 1938. In the 1950s, Crossbar #5 arrived and it became a hit worldwide. Crossbar #5 switches usually stood alone or worked alongside older switching equipment in fast growing exchanges. It occupied less space, worked well without obsessive maintenance, and was reliable.
It was not until the 1970s that the Bell System decided to completely scrap their electromechanical switches in favor of newer electronic technology. The advantages were obvious — the newer equipment occupied a fraction of the space and had considerably more capacity than older switches. That became critical in New York starting in the late 1960s when customer demand for additional phone lines exploded. New York Telephone simply could not keep up with and waiting lists often grew to weeks as technicians looked for spare capacity. The Bell System’s answer to this growth was a new generation of electronic switches.
The #1 ESS was an analog electronic switch first introduced in New Jersey in 1965. Although it worked fine in smaller and medium-sized communities, the switch’s software bugs were notorious when traffic on the exchange reached peak loads. It was clear to New York Telephone the #1 ESS was not ready for Manhattan until the bugs were squashed.
Bell companies, along with some independent phone companies that depended on the same equipment, moved cautiously to begin upgrades. It would take North American phone companies until August 2001 to retire what was reportedly the last electromechanical switch, serving the small community of Nantes, Quebec.
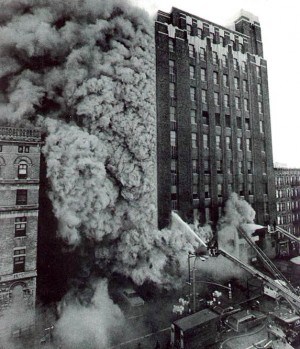
A notorious 1975 fire destroyed a phone exchange serving lower Manhattan. That was one way to guarantee an upgrade from New York Telephone.
On rare occasions, phone companies didn’t have much of a choice. The most notorious example of this was the Feb. 27, 1975 fire in the telephone exchange located at 204 Second Avenue and East 13th Street in New York. The five alarm fire destroyed the switching equipment and knocked out telephone service for 173,000 customers before 700 firefighters from 72 fire units managed to put the fire out more than 16 hours later. That fire is still memorialized today by New York firefighters because it injured nearly 300 of them. But the fire’s legacy continued for decades as long-term health effects, including cancer, from the toxic smoke would haunt those who fought it.
The New York Telephone building still stands and today also houses a street level Verizon Wireless retail store.
New York Telephone engineers initially rescued a decommissioned #1 Crossbar switch waiting to be melted down for scrap. It came from the West 18th Street office and was cleaned and repaired and put into emergency service until a #1 ESS switch originally destined for another central office was diverted. This part of Manhattan got its upgrade earlier for all the wrong reasons.
Throughout the Bell System in the 1970s and 80s, older switches were gradually replaced in favor of all electronic switches, especially the #5 ESS, introduced in 1982 and still widely in service today, serving about 50% of all landlines in the United States. Canadian telephone companies often favored telephone switches manufactured by Northern Telecom (Nortel), based in Mississauga, Ontario. They generally worked equally well as the American counterpart and are also in service in parts of the United States.
The legacy of more than 100 years of telephone service has made running old and new technology side by side nothing unusual for telephone companies. It has worked for them before, as has their belief in incremental upgrades. So Bell’s announcement it would completely blanket Toronto with all-fiber service is a departure from standard practice.
For Bell in Toronto, the gigabit upgrade will begin by pushing fiber cables through existing conduits that are also home to copper and fiber wiring still in service. If a conduit is blocked or lacks enough room to get new fiber cables through, the Bell technician predicted delays. It is very likely that sometime after fiber service is up and running, copper wire decommissioning will begin in Toronto. Whether those cables remain dormant underground and on phone poles for cost reasons or torn out and sold for scrap will largely depend on scrap copper prices, Bell’s budget, and possible regulator intervention.
But Bell’s upgrade will clearly be as important, if not more so, than the retirement of mechanical phone switches a few decades earlier. For the same reasons — decreased maintenance costs, increased capacity, better reliability, and the possibility to market new services for revenue generation make fiber just as good of an investment for Bell as electronic switches were in the 1970s and 1980s.
[flv]http://www.phillipdampier.com/video/ATT Reconnecting 170000 Phone Customers in NYC After a Major Fire 1975.mp4[/flv]
AT&T produced this documentary in the mid-1970s about how New York Telephone recovered from a fire that destroyed a phone exchange in lower Manhattan and wiped out service for 173,000 customers in 1975. The phone company managed to get service restored after an unprecedented three weeks. It gives viewers a look at the enormous size of old electromechanical switching equipment and masses of phone wiring. (22:40)

 Subscribe

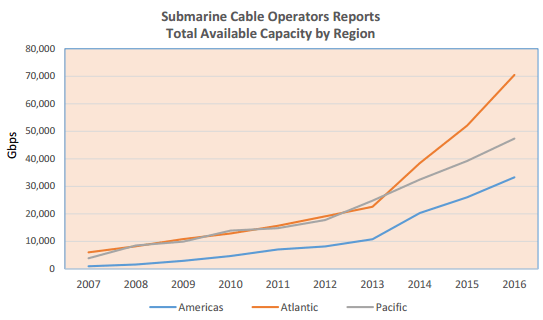 Overall submarine cable capacity, which supports a substantial amount of international Internet traffic, has grown around 36% per year for 2007-2014 and is expected to grow around 29% for 2014-2016. But traffic planners are confident the traffic growth will be easily accommodated over existing submarine cable circuits.
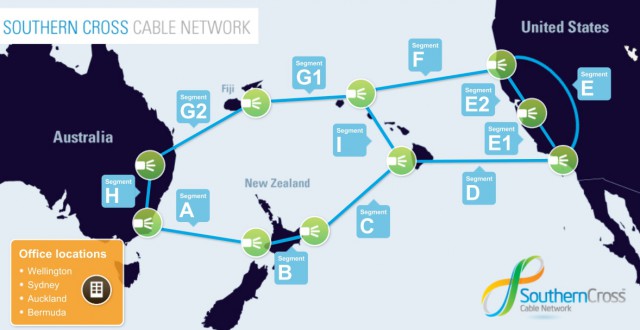
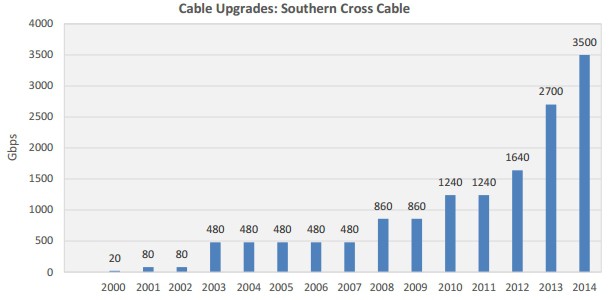 Southern Cross engineers are now deploying circuits capable of 40 and 100Gbps technology, bringing Southern Cross cable’s total available capacity to more than 12Tbps (12,000Gbps). Every upgrade was conducted at the cable station with zero new fiber pairs laid in the water. Other undersea cable operators are initiating similar upgrades, providing exponentially greater capacity at a minimal cost.