 The Federal Communications Commission’s July report on America’s broadband speeds shows virtually every major national provider, with the exception of Frontier Communications, made significant improvements in delivering the broadband service and speeds they advertise to customers.
Utilizing thousands of volunteer testers agreeing to host a router that performs automated speed tests and other sampling measurements (full disclosure: your editor is a volunteer participant), the FCC speed measurement program is one of the most comprehensive independent broadband assessments in the country.
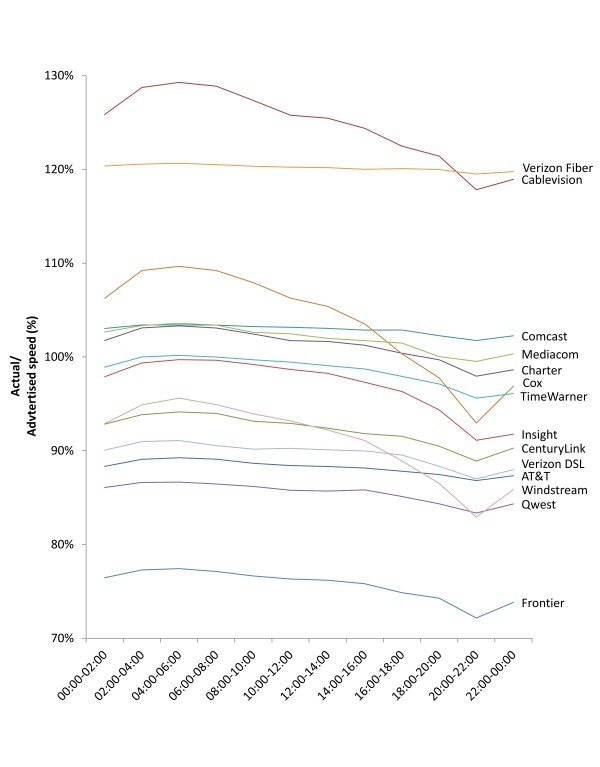
Hourly Sustained Download Speeds as a Percentage of Advertised, by Provider—April 2012 Test Data
The FCC found Cablevision’s improvements last year paid off handsomely for the company, which now effectively ties with Verizon Communication’s FiOS fiber-to-the-home service for delivering promised speeds during peak usage times. The cable operator was embarrassed in 2011 when the FCC found Cablevision broadband customers’ speeds plummeted during Internet use prime time. Those problems have since been corrected with infrastructure upgrades — particularly important for a cable operator that features near-ubiquitous competition from Verizon’s fiber network.
“This report demonstrates our commitment to delivering more than 100 percent of the speeds we advertise to our broadband customers – over the entire day and during peak hours – in addition to free access to the nation’s largest Wi-Fi network and other valuable product features and enhancements,” said Amalia O’Sullivan, Cablevision’s vice president of broadband operations.
Verizon also blew its own horn in a press statement released this afternoon.
“Verizon’s FiOS service continues to demonstrate its mastery of broadband speed, reliability and consistency for consumers as represented in today’s FCC-SamKnows residential broadband report,” said Mike Ritter, chief marketing officer for Verizon’s consumer and mass market business unit. “The FCC’s findings reaffirm the results from the 2011 report, which found that FiOS provides blazing-fast and sustained upstream and downstream speeds even during peak usage periods. This year’s results also show once again that FiOS Internet customers are receiving speeds that meet or exceed those we advertise, adding even more value to the customer experience.”
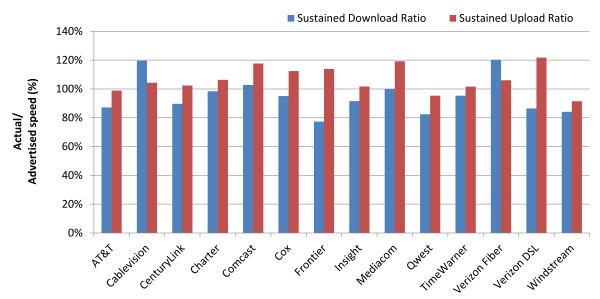
Average Peak Period Sustained Download and Upload Speeds as a Percentage of Advertised, by Provider—April 2012 Test Data
Cable operators’ investments in DOCSIS 3 technology also allowed their broadband networks to perform well even as broadband usage continues to grow. Comcast delivered 103% of promised speeds during peak usage, Time Warner Cable – 96%, and Cox – 95%.
Just one nationwide provider lost ground in the last year — Frontier Communications, whose DSL service has grown more congested than ever, with insufficient investment in network upgrades apparent by the company’s dead-last results.
Frontier managed 81% of promised speeds in 2011, partly thanks to its inherited fiber to the home network. This year, it managed only 79%.
Frontier performed adequately for customers choosing its lowest 1Mbps speed tier. It also performed well in areas where its fiber network can sustain much faster speeds. The biggest problems show up for Frontier’s DSL customers buying service at speeds of 3-10Mbps. At peak times, network congestion brings those speeds down.
On average, the FCC found fiber to the home service delivers the best broadband performance, followed by cable broadband, and then telephone company DSL. Five ISPs now routinely deliver nearly one hundred percent or greater of the speed advertised to the consumer even during time periods when bandwidth demand is at its peak. In the August 2011 Report, only two ISPs met this level of performance. In 2011, the average ISP delivered 87 percent of advertised download speed during peak usage periods; in 2012, that jumped to 96 percent. In other words, consumers today are experiencing performance more closely aligned with what is advertised than they experienced one year ago.
The FCC report also found that outlier performers in the 2011 study, with the exception of Frontier, worked hard to make their differences in performance disappear. Last year, the standard deviation from promised broadband speeds was 14.4 percent. This year it is 12.2 percent.
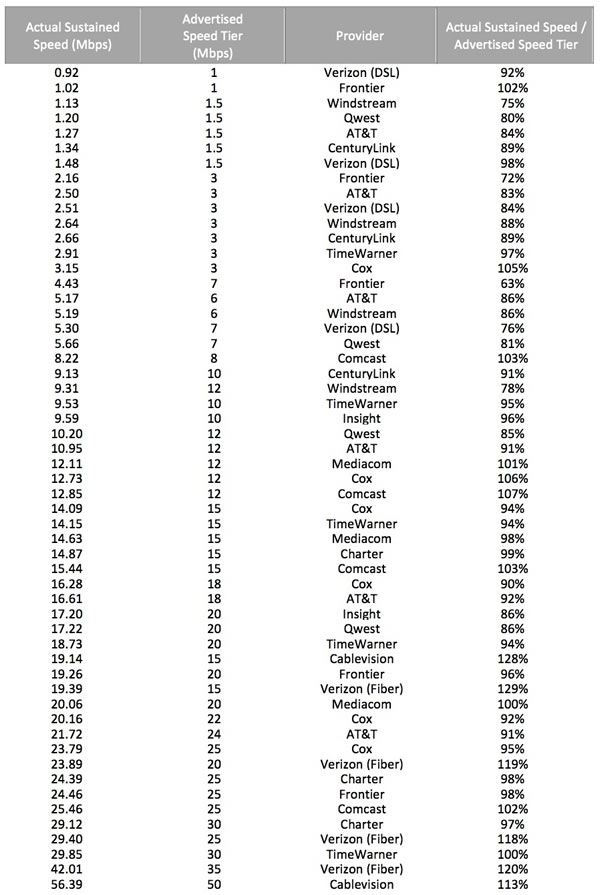
Peak Period Sustained Download Performance, by Provider—April 2012 Test Data
The FCC also found consumers are gravitating towards higher-priced, higher-speed broadband service. Last year’s average broadband speed tier was 11.1Mbps. This year it is 14.3Mbps, almost 30% higher. Along with faster speeds comes more usage. Customers paying for more speed expect to use their broadband connections more, and the FCC found they do.
Overall, the FCC was encouraged to see broadband speed tiers on the increase, some to 100Mbps or higher.
Highlights from the report:
- Actual versus advertised speeds. The August 2011 Report showed that the ISPs included in the Report were, on average, delivering 87 percent of advertised speeds during the peak consumer usage hours of weekdays from 7:00 pm to 11:00 pm local time. The July 2012 Report finds that ISP performance has improved overall, with ISPs delivering on average 96 percent of advertised speeds during peak intervals, and with five ISPs routinely meeting or exceeding advertised rates.
- Sustained download speeds as a percentage of advertised speeds. The average actual sustained download speed during the peak period was calculated as a percentage of the ISP’s advertised speed. This calculation was done for each speed tier offered by each ISP.
- Results by technology:
- On average, during peak periods DSL-based services delivered download speeds that were 84 percent of advertised speeds, cable-based services delivered 99 percent of advertised speeds, and fiber-to-the-home services delivered 117 percent of advertised speeds. This compared with 2011 results showing performance levels of 82 percent for DSL, 93 percent for cable, and 114 percent for fiber. All technologies improved in 2012.
- Peak period speeds decreased from 24-hour average speeds by 0.8 percent for fiber-to-the-home services, 3.4 percent for DSL-based services and 4.1 percent for cable-based services. This compared with 0.4 percent for fiber services, 5.5 percent for DSL services and 7.3 percent for cable services in 2011.
- Results by ISP:
- Average peak period download speeds varied from a high of 120 percent of advertised speed to a low of 77 percent of advertised speed. This is a dramatic improvement from last year where these numbers ranged from a high of 114 percent to a low of 54 percent.
- In 2011, on average, ISPs had a 6 percent decrease in delivered versus advertised download speed between their 24 hour average and their peak period average. In 2012, average performance improved, and there was only a 3 percent decrease in performance between 24 hour and peak averages.
- Sustained upload speeds as a percentage of advertised speeds. With the exception of one provider, upload speeds during peak periods were 95 percent or better of advertised speeds. On average, across all ISPs, upload speed was 107 percent of advertised speed. While this represents improvement over the 103 percent measured for 2011, upload speeds have not been a limiting factor in performance and most ISPs last year met or exceeded their advertised upload speeds. Upload speeds showed little evidence of congestion with little variance between 24 hour averages and peak period averages.
- Results by technology: On average, fiber-to-the-home services delivered 106 percent, DSL-based services delivered 103 percent, and cable-based services delivered 110 percent of advertised upload speeds. These compare with figures from 2011 of 112 percent for fiber, 95 percent for DSL, and 108 percent for cable.
- Results by ISP: Average upload speeds among ISPs ranged from a low of 91 percent of advertised speed to a high of 122 percent of advertised speed. In 2011, this range was from a low of 85 percent to a high of 125 percent.
- Latency. Latency is the time it takes for a packet of data to travel from one designated point to another in a network, commonly expressed in terms of milliseconds (ms). Latency can be a major controlling factor in overall performance of Internet services. In our tests, latency is defined as the round-trip time from the consumer’s home to the closest server used for speed measurement within the provider’s network. We were not surprised to find latency largely unchanged from last year, as it primarily depends upon factors intrinsic to a specific architecture and is largely outside the scope of improvement if networks are appropriately engineered. In 2012, across all technologies, latency averaged 31 milliseconds (ms), as opposed to 33 ms measured in 2011.
- During peak periods, latency increased across all technologies by 6.5 percent, which represents a modest drop in performance. In 2011 this figure was 8.7 percent.
- Results by technology:
- Latency was lowest in fiber-to-the-home services, and this finding was true across all fiber-to-the-home speed tiers.
- Fiber-to-the-home services provided 18 ms round-trip latency on average, while cable-based services averaged 26 ms, and DSL-based services averaged 43 ms. This compares to 2011 figures of 17 ms for fiber, 28 ms for cable and 44 ms for DSL.
- Results by ISP: The highest average round-trip latency for an individual service tier among ISPs was 70.2 ms, while the lowest average latency within a single service tier was 12.6 ms. This compares to last year’s maximum latency of 74.8 ms and minimum of 14.5 ms.
- Effect of burst speed techniques. Some cable-based services offer burst speed techniques, marketed under names such as “PowerBoost,” which temporarily allocate more bandwidth to a consumer’s service. The effect of burst speed techniques is temporary—it usually lasts less than 15 to 20 seconds—and may be reduced by other broadband activities occurring within the consumer household. Burst speed is not equivalent to sustained speed. Sustained speed is a measure of long-term performance. Activities such as large file transfers, video streaming, and video chat require the transfer of large amounts of information over long periods of time. Sustained speed is a better measure of how well such activities may be supported. However, other activities such as web browsing or gaming often require the transfer of moderate amounts of information in a short interval of time. For example, a transfer of a web page typically begins with a consumer clicking on the page reference and ceases when the page is fully downloaded. Such services may benefit from burst speed techniques, which for a period of seconds will increase the transfer speed. The actual effect of burst speed depends on a number of factors explained more fully below.
- Burst speed techniques increased short-term download performance by as much as 112 percent during peak periods for some speed tiers. The benefits of burst techniques are most evident at intermediate speeds of around 8 to 15 Mbps and appear to tail off at much higher speeds. This compares to 2011 results with maximum performance increases of approximately 50 percent at rates of 6 to 7 Mbps with tail offs in performance beyond this.
- Web Browsing, Voice over Internet Protocol (VoIP), and Streaming Video.
- Web browsing. In specific tests designed to mimic basic web browsing—accessing a series of web pages, but not streaming video or using video chat sites or applications—the total time needed to load a page decreased with higher speeds, but only up to about 10 Mbps. Latency and other factors limited response time starting around speed tiers of 10 Mbps and higher. For these high speed tiers, consumers are unlikely to experience much if any improvement in basic web browsing from increased speed–i.e., moving from a 10 Mbps broadband offering to a 25 Mbps offering. This is comparable to results obtained in 2011 and suggests intrinsic factors (e.g. effects of latency, protocol limitations) limit overall performance at higher speeds. It should be noted that this is from the perspective of a single user with a browser and that higher speeds may provide significant advantages in a multi-user household or where a consumer is using a specific application that may be able to benefit from a higher speed tier.
- VoIP. VoIP services, which can be used with a data rate as low as 100 kilobits per second (kbps) but require relatively low latency, were adequately supported by all of the service tiers discussed in this Report. However, VoIP quality may suffer during times when household bandwidth is shared by other services. The VoIP measurements utilized for this Report were not designed to detect such effects.
- Streaming Video. 2012 test results suggest that video streaming will work across all technologies tested, though the quality of the video that can be streamed will depend upon the speed tier. For example, standard definition video is currently commonly transmitted at speeds from 1 Mbps to 2 Mbps. High quality video can demand faster speeds, with full HD (1080p) demanding 5 Mbps or more for a single stream. Consumers should understand the requirements of the streaming video they want to use and ensure that their chosen broadband service tier will meet those requirements, including when multiple members of a household simultaneously want to watch streaming video on separate devices. For the future, video content delivery companies are researching ultra high definition video services (e.g. 4K technology which has a resolution of 12 Megapixels per frame versus present day 1080p High Definition television with a 2 Megapixel resolution), which would require higher transmission speeds.
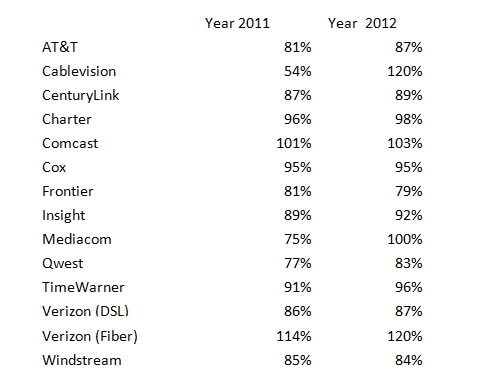
Year by Year Comparison of Sustained Actual Download Speed as a Percentage of Advertised Speed (2011/2012)


 Subscribe