Home » docsis 3 » Recent Articles:

Competition Works: Cox Business Unveils 80-100Mbps Broadband to Compete with LUS in Louisiana

Cox Communications has launched two new broadband tiers for business customers in the Acadiana region around Lafayette, La., offering speeds of  80 and 100Mbps.

With LUS Fiber providing community-owned fiber to the premises symmetrical broadband in the area, Cox Cable has been at a speed disadvantage, but hopes it is now better positioned to attract and keep commercial customers in southern Louisiana. LUS Fiber offers business customers speeds of 10/10, 50/50, or 100/100Mbps.

Cox’s new speeds, made possible with DOCSIS 3.0, are part of a $12 million upgrade the cable operator has underway in the state. Acadiana is the first Cox market in the country to get the new speeds. Other Cox markets will see upgraded speeds later this year or in early 2013.

Rogers Bumps ‘Lite’ Usage Tier Allowance Up 5GB a Month, Speed Now 6Mbps

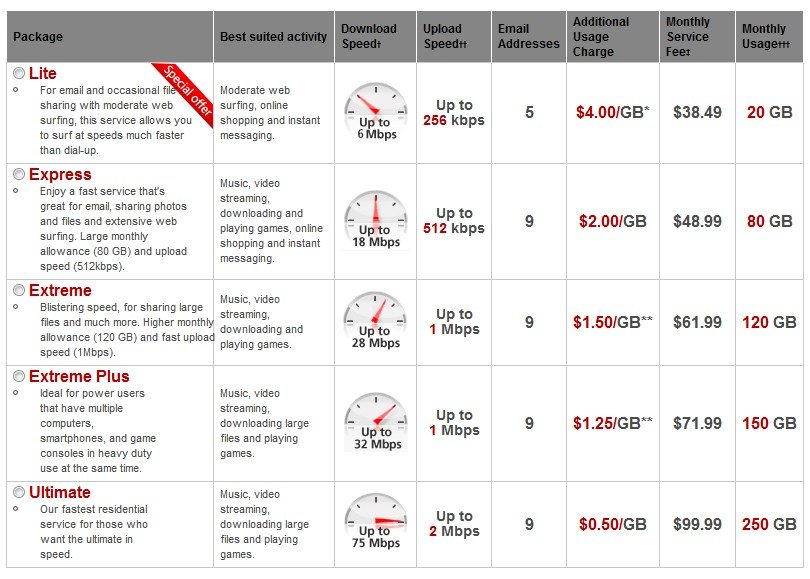
Rogers Communications has slightly bumped the monthly usage allowance for its “Lite” Internet plan up by 5GB per month to 20GB. The company also doubled the speed of the entry-level package from 3Mbps to 6Mbps. Upload speed remains at 256kbps.

But the plan still carries a hefty price — $38.49 a month, and there is a stiff $4/GB overlimit fee for those who exceed their allowance. Just south of Lake Ontario, Time Warner Cable’s “special offer” provides cap-free 10/1Mbps broadband for $29.99 a month for a year.

Our regular reader Alex mocks the move as another example of Canadian competition at work for consumers. Rogers has made only small adjustments to their usage caps since last summer, and customers who want the most generous usage allowances (paltry when compared to western Canadian ISPs), have to spend money out of pocket to upgrade to DOCSIS 3 technology.

As of today, here is the current roundup of Internet plans from Rogers

Rogers always adds a lot of fine print. For these offers, here come the disclaimers and special conditions:

  • Taxes and a $14.95 one-time activation fee apply. Internet modem purchase or monthly rental required.
  • †Speeds may vary with Internet traffic, server or other factors. Also see the Acceptable Use Policy at rogers.com/terms. Modem set-up: the system is configured to maximum modem capabilities within Rogers own network.
  • ††In some areas, Rogers manages upstream peer-to-peer (P2P) file sharing applications speed to a maximum of 80 kbps per customer for Rogers Hi-Speed Internet (delivered over cable). This policy is maintained at all times. For information on Rogers Internet traffic management practices and Legal Disclosure click here.
  • †††Usage allowances apply on a monthly basis and vary by tier of service. Charges apply for additional use beyond the monthly usage allowance associated with your tier of service. For details, visit rogers.com/keepingpace.
  • *Note for Lite customers: If you signed up for Lite before July 21st, 2010, your usage allowance remains at 25 GB, and your additional usage charges remains at $2.50/GB.
  • **Note for Extreme customers: If you signed up for Extreme before July 21st, 2010, your download speed remains at 10 Mbps and your usage allowance remains at 95 GB.

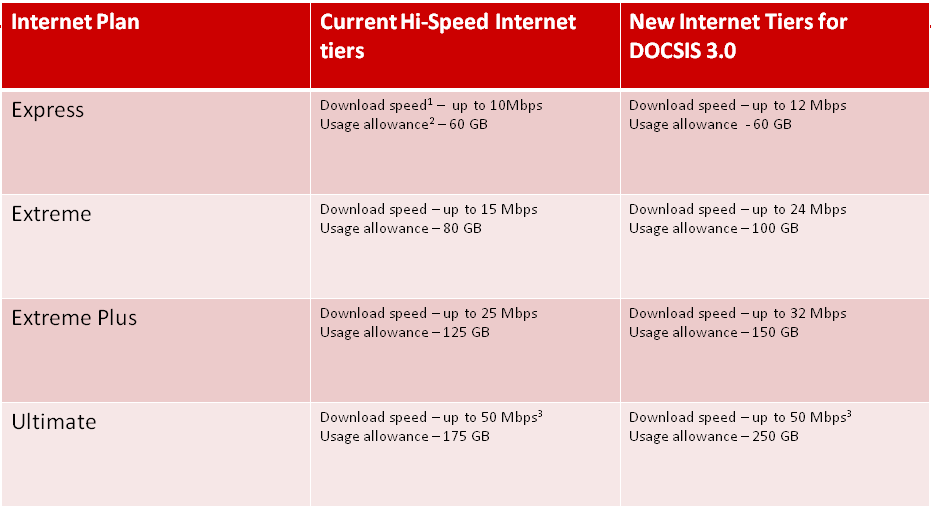
If you want to compare Rogers’ allowances to what they sold in July 2011, here is a reminder:

Time Warner Cable Moving to All-IP Network, Channel Realignment, DVR/Box Changes

Time Warner Cable executives told investors on a morning conference call the cable company has embarked on a gradual transition to an all-IP-based distribution platform which could eventually mean the end of today’s set top boxes and radically increase the amount of bandwidth available for its broadband and video networks.

“Whatever the merits of that from an engineering sense, all things IP are the standards that the world is building devices to,” said Time Warner Cable CEO Glenn Britt. “So that’s the standard we’re going to end up migrating to until something better comes along.”

The transition will help Time Warner Cable support additional customer-owned equipment, including video game consoles, streaming online video boxes, and televisions with built-in support for cable-delivered channels.

“If you look at the cable in 1980s, there weren’t a lot of set-tops, and I think we’re going back to that over time,” Britt said.

Britt has repeatedly criticized set top box equipment as cumbersome, expensive, outdated, and disliked from the perspective of customers. He noted the only reason Time Warner uses the boxes is to support traditional televisions that cannot handle all of the services the cable company offers today, including video-on-demand and encrypted premium channels. Moving to a different technology platform can result in significant savings if cable operators adopt open standard devices and technology.

Later this year, Time Warner will also be launching a nationwide channel realignment, affecting virtually every subscriber around the country. The cable company is adopting a unified, genre-based, national channel lineup, putting popular cable networks on identical channel numbers in every city.

Time Warner’s reported results found the company losing an additional 169,000 video subscribers during the quarter, a new record loss for the cable operator. Despite that, the company still booked an 8% increase in profits, thanks to higher prices for service and increases in the number of broadband customers. Time Warner blamed the video subscriber drop on seasonal losses from departing college students and those heading to vacation properties, as well as the downturned economy.

But the nation’s second biggest cable operator reports it has several initiatives under way for subscribers which they feel will boost earnings and subscriber numbers:

Over the last 60 days, Time Warner deployed a new set-top box guide throughout the eastern region. After the Olympics conclude, the company will introduce the new guide across the western half of the country. The new guide features a new color scheme and better graphics, and is supposed to make navigation and search easier to use;

The company will introduce IP-based set top boxes and home gateway devices by next year. The newest gateway is a combination DVR, DOCSIS 3.0 cable modem, and a video transcoder that can convert QAM-based video to IP for devices including game consoles and new IP set top boxes. Time Warner’s newest DVR will include the capability of recording five shows at the same time while watching another and 1TB of storage.
Install it yourself.

Time Warner Cable’s TV Everywhere service will expand to include video on demand and the possibility of watching certain networks while outside of the home. The current service only works when you watch over your home Wi-Fi network.

The cable operator’s Internet Essentials offer, which includes a 5GB monthly usage cap, will move beyond Texas and reach everywhere the cable operator serves by the second half of next year. When a usage meter shows up on your My Services page on Time Warner Cable’s website, you will know this new, optional plan is on the way.

Time Warner is revamping their website to let customers shop, order, and buy more services online.

Self-install kits will become increasingly common for customers comfortable installing their own services. The Easy Connect packages are available in stores or by mail, and are free of charge with no installation fee.

Service call windows will continue to be refined. In most cities, two hour windows are currently offered, but the company is now moving to one-hour windows in many markets. In some cities, 15-minute windows for the first appointment of each shift are now available to customers who don’t want to sit at home and wait all day for the cable guy. The company is now also including an estimate of how long it typically takes to complete the type of service call requested.

 Customers continue to gravitate towards faster broadband service plans. The company’s Turbo, Extreme and Ultimate tiers together garnered 157,000 new adds in the second quarter and now comprise over 21% of high-speed data customers, up from 17% a year ago and 9% three years ago.

Britt also took questions about the impact Google Fiber will have on Time Warner Cable’s operations in Kansas City.

“There’s a lot of effort going on around the country to see what we could do as a society with more bandwidth in kind of a laboratory sense,” Britt said. “I view the Google effort as that. […] And I think that’s good for our business. We have a wonderful infrastructure, we have bandwidth, we have a way to go much faster with DOCSIS 3.0 by adding [higher speeds] to the offering. And the more the people figure out how to use broadband, the better off we’re going to be. So I think this is a good thing, not a bad thing, that people are trying to figure out how to use this technology.”

Latest FCC Report on Broadband Speeds: Good for Verizon, Cablevision; Bad for Frontier

The Federal Communications Commission’s July report on America’s broadband speeds shows virtually every major national provider, with the exception of Frontier Communications, made significant improvements in delivering the broadband service and speeds they advertise to customers.

Utilizing thousands of volunteer testers agreeing to host a router that performs automated speed tests and other sampling measurements (full disclosure: your editor is a volunteer participant), the FCC speed measurement program is one of the most comprehensive independent broadband assessments in the country.

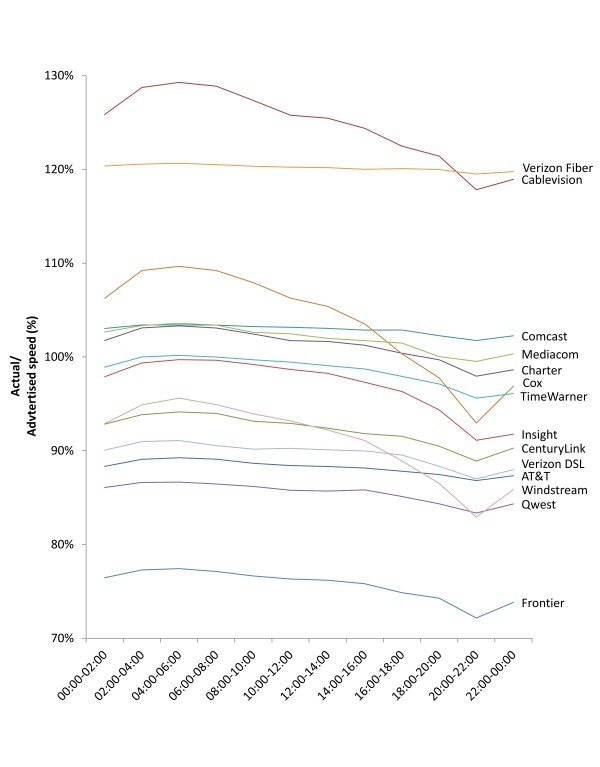
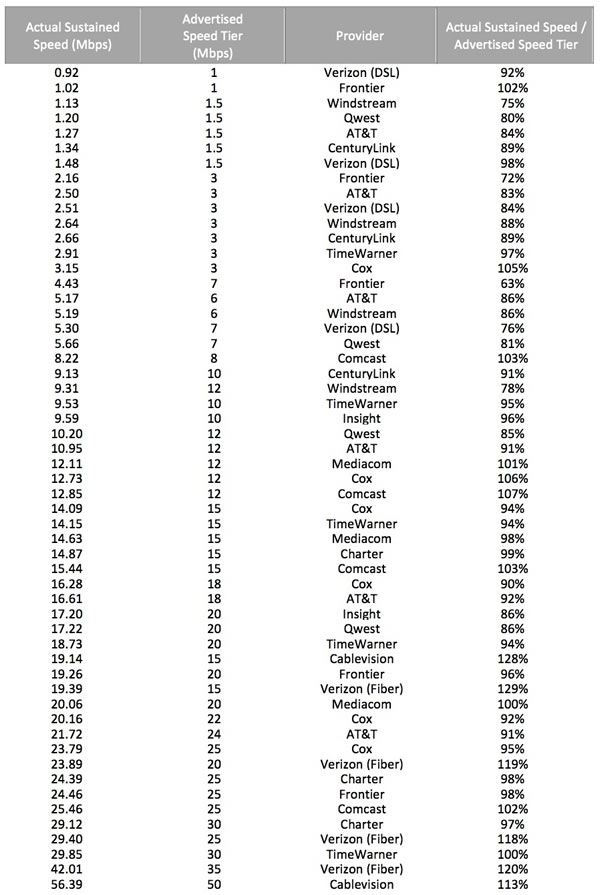
Hourly Sustained Download Speeds as a Percentage of Advertised, by Provider—April 2012 Test Data

The FCC found Cablevision’s improvements last year paid off handsomely for the company, which now effectively ties with Verizon Communication’s FiOS fiber-to-the-home service for delivering promised speeds during peak usage times. The cable operator was embarrassed in 2011 when the FCC found Cablevision broadband customers’ speeds plummeted during Internet use prime time. Those problems have since been corrected with infrastructure upgrades — particularly important for a cable operator that features near-ubiquitous competition from Verizon’s fiber network.

“This report demonstrates our commitment to delivering more than 100 percent of the speeds we advertise to our broadband customers – over the entire day and during peak hours – in addition to free access to the nation’s largest Wi-Fi network and other valuable product features and enhancements,” said Amalia O’Sullivan, Cablevision’s vice president of broadband operations.

Verizon also blew its own horn in a press statement released this afternoon.

“Verizon’s FiOS service continues to demonstrate its mastery of broadband speed, reliability and consistency for consumers as represented in today’s FCC-SamKnows residential broadband report,” said Mike Ritter, chief marketing officer for Verizon’s consumer and mass market business unit. “The FCC’s findings reaffirm the results from the 2011 report, which found that FiOS provides blazing-fast and sustained upstream and downstream speeds even during peak usage periods. This year’s results also show once again that FiOS Internet customers are receiving speeds that meet or exceed those we advertise, adding even more value to the customer experience.”

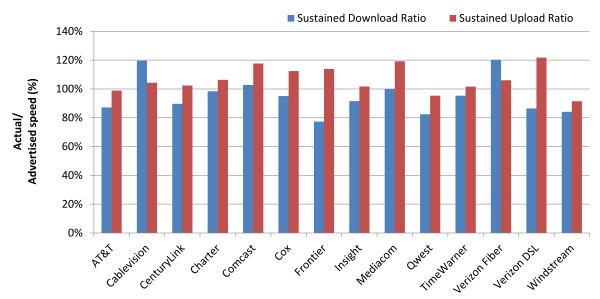
Average Peak Period Sustained Download and Upload Speeds as a Percentage of Advertised, by Provider—April 2012 Test Data

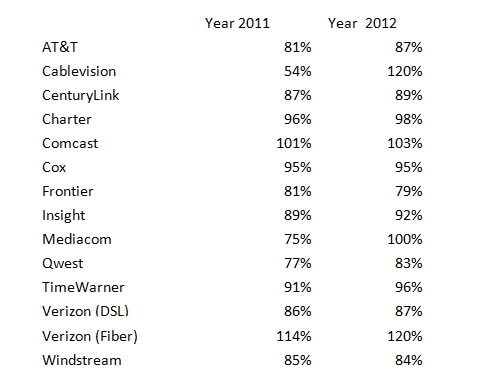
Cable operators’ investments in DOCSIS 3 technology also allowed their broadband networks to perform well even as broadband usage continues to grow. Comcast delivered 103% of promised speeds during peak usage, Time Warner Cable – 96%, and Cox – 95%.

Just one nationwide provider lost ground in the last year — Frontier Communications, whose DSL service has grown more congested than ever, with insufficient investment in network upgrades apparent by the company’s dead-last results.

Frontier managed 81% of promised speeds in 2011, partly thanks to its inherited fiber to the home network. This year, it managed only 79%.

Frontier performed adequately for customers choosing its lowest 1Mbps speed tier. It also performed well in areas where its fiber network can sustain much faster speeds. The biggest problems show up for Frontier’s DSL customers buying service at speeds of 3-10Mbps. At peak times, network congestion brings those speeds down.

On average, the FCC found fiber to the home service delivers the best broadband performance, followed by cable broadband, and then telephone company DSL. Five ISPs now routinely deliver nearly one hundred percent or greater of the speed advertised to the consumer even during time periods when bandwidth demand is at its peak. In the August 2011 Report, only two ISPs met this level of performance. In 2011, the average ISP delivered 87 percent of advertised download speed during peak usage periods; in 2012, that jumped to 96 percent. In other words, consumers today are experiencing performance more closely aligned with what is advertised than they experienced one year ago.

The FCC report also found that outlier performers in the 2011 study, with the exception of Frontier, worked hard to make their differences in performance disappear. Last year, the standard deviation from promised broadband speeds was 14.4 percent. This year it is 12.2 percent.

Peak Period Sustained Download Performance, by Provider—April 2012 Test Data

The FCC also found consumers are gravitating towards higher-priced, higher-speed broadband service. Last year’s average broadband speed tier was 11.1Mbps. This year it is 14.3Mbps, almost 30% higher. Along with faster speeds comes more usage. Customers paying for more speed expect to use their broadband connections more, and the FCC found they do.

Overall, the FCC was encouraged to see broadband speed tiers on the increase, some to 100Mbps or higher.

Highlights from the report:

  • Actual versus advertised speeds. The August 2011 Report showed that the ISPs included in the Report were, on average, delivering 87 percent of advertised speeds during the peak consumer usage hours of weekdays from 7:00 pm to 11:00 pm local time. The July 2012 Report finds that ISP performance has improved overall, with ISPs delivering on average 96 percent of advertised speeds during peak intervals, and with five ISPs routinely meeting or exceeding advertised rates.
  • Sustained download speeds as a percentage of advertised speeds. The average actual sustained download speed during the peak period was calculated as a percentage of the ISP’s advertised speed. This calculation was done for each speed tier offered by each ISP.
    • Results by technology:
      • On average, during peak periods DSL-based services delivered download speeds that were 84 percent of advertised speeds, cable-based services delivered 99 percent of advertised speeds, and fiber-to-the-home services delivered 117 percent of advertised speeds. This compared with 2011 results showing performance levels of 82 percent for DSL, 93 percent for cable, and 114 percent for fiber. All technologies improved in 2012.
      • Peak period speeds decreased from 24-hour average speeds by 0.8 percent for fiber-to-the-home services, 3.4 percent for DSL-based services and 4.1 percent for cable-based services. This compared with 0.4 percent for fiber services, 5.5 percent for DSL services and 7.3 percent for cable services in 2011.
    • Results by ISP:
      • Average peak period download speeds varied from a high of 120 percent of advertised speed to a low of 77 percent of advertised speed. This is a dramatic improvement from last year where these numbers ranged from a high of 114 percent to a low of 54 percent.
      • In 2011, on average, ISPs had a 6 percent decrease in delivered versus advertised download speed between their 24 hour average and their peak period average. In 2012, average performance improved, and there was only a 3 percent decrease in performance between 24 hour and peak averages.
  • Sustained upload speeds as a percentage of advertised speeds. With the exception of one provider, upload speeds during peak periods were 95 percent or better of advertised speeds. On average, across all ISPs, upload speed was 107 percent of advertised speed. While this represents improvement over the 103 percent measured for 2011, upload speeds have not been a limiting factor in performance and most ISPs last year met or exceeded their advertised upload speeds. Upload speeds showed little evidence of congestion with little variance between 24 hour averages and peak period averages.
    • Results by technology: On average, fiber-to-the-home services delivered 106 percent, DSL-based services delivered 103 percent, and cable-based services delivered 110 percent of advertised upload speeds. These compare with figures from 2011 of 112 percent for fiber, 95 percent for DSL, and 108 percent for cable.
    • Results by ISP: Average upload speeds among ISPs ranged from a low of 91 percent of advertised speed to a high of 122 percent of advertised speed. In 2011, this range was from a low of 85 percent to a high of 125 percent.
  • Latency. Latency is the time it takes for a packet of data to travel from one designated point to another in a network, commonly expressed in terms of milliseconds (ms). Latency can be a major controlling factor in overall performance of Internet services. In our tests, latency is defined as the round-trip time from the consumer’s home to the closest server used for speed measurement within the provider’s network. We were not surprised to find latency largely unchanged from last year, as it primarily depends upon factors intrinsic to a specific architecture and is largely outside the scope of improvement if networks are appropriately engineered. In 2012, across all technologies, latency averaged 31 milliseconds (ms), as opposed to 33 ms measured in 2011.
    • During peak periods, latency increased across all technologies by 6.5 percent, which represents a modest drop in performance. In 2011 this figure was 8.7 percent.
      • Results by technology:
        • Latency was lowest in fiber-to-the-home services, and this finding was true across all fiber-to-the-home speed tiers.
        • Fiber-to-the-home services provided 18 ms round-trip latency on average, while cable-based services averaged 26 ms, and DSL-based services averaged 43 ms. This compares to 2011 figures of 17 ms for fiber, 28 ms for cable and 44 ms for DSL.
      • Results by ISP: The highest average round-trip latency for an individual service tier among ISPs was 70.2 ms, while the lowest average latency within a single service tier was 12.6 ms. This compares to last year’s maximum latency of 74.8 ms and minimum of 14.5 ms.
  • Effect of burst speed techniques. Some cable-based services offer burst speed techniques, marketed under names such as “PowerBoost,” which temporarily allocate more bandwidth to a consumer’s service. The effect of burst speed techniques is temporary—it usually lasts less than 15 to 20 seconds—and may be reduced by other broadband activities occurring within the consumer household. Burst speed is not equivalent to sustained speed. Sustained speed is a measure of long-term performance. Activities such as large file transfers, video streaming, and video chat require the transfer of large amounts of information over long periods of time. Sustained speed is a better measure of how well such activities may be supported. However, other activities such as web browsing or gaming often require the transfer of moderate amounts of information in a short interval of time. For example, a transfer of a web page typically begins with a consumer clicking on the page reference and ceases when the page is fully downloaded. Such services may benefit from burst speed techniques, which for a period of seconds will increase the transfer speed. The actual effect of burst speed depends on a number of factors explained more fully below.
    • Burst speed techniques increased short-term download performance by as much as 112 percent during peak periods for some speed tiers. The benefits of burst techniques are most evident at intermediate speeds of around 8 to 15 Mbps and appear to tail off at much higher speeds. This compares to 2011 results with maximum performance increases of approximately 50 percent at rates of 6 to 7 Mbps with tail offs in performance beyond this.
  • Web Browsing, Voice over Internet Protocol (VoIP), and Streaming Video.
    • Web browsing. In specific tests designed to mimic basic web browsing—accessing a series of web pages, but not streaming video or using video chat sites or applications—the total time needed to load a page decreased with higher speeds, but only up to about 10 Mbps. Latency and other factors limited response time starting around speed tiers of 10 Mbps and higher. For these high speed tiers, consumers are unlikely to experience much if any improvement in basic web browsing from increased speed–i.e., moving from a 10 Mbps broadband offering to a 25 Mbps offering. This is comparable to results obtained in 2011 and suggests intrinsic factors (e.g. effects of latency, protocol limitations) limit overall performance at higher speeds. It should be noted that this is from the perspective of a single user with a browser and that higher speeds may provide significant advantages in a multi-user household or where a consumer is using a specific application that may be able to benefit from a higher speed tier.
    • VoIP. VoIP services, which can be used with a data rate as low as 100 kilobits per second (kbps) but require relatively low latency, were adequately supported by all of the service tiers discussed in this Report. However, VoIP quality may suffer during times when household bandwidth is shared by other services. The VoIP measurements utilized for this Report were not designed to detect such effects.
    • Streaming Video. 2012 test results suggest that video streaming will work across all technologies tested, though the quality of the video that can be streamed will depend upon the speed tier. For example, standard definition video is currently commonly transmitted at speeds from 1 Mbps to 2 Mbps. High quality video can demand faster speeds, with full HD (1080p) demanding 5 Mbps or more for a single stream. Consumers should understand the requirements of the streaming video they want to use and ensure that their chosen broadband service tier will meet those requirements, including when multiple members of a household simultaneously want to watch streaming video on separate devices. For the future, video content delivery companies are researching ultra high definition video services (e.g. 4K technology which has a resolution of 12 Megapixels per frame versus present day 1080p High Definition television with a 2 Megapixel resolution), which would require higher transmission speeds.

Year by Year Comparison of Sustained Actual Download Speed as a Percentage of Advertised Speed (2011/2012)


Comcast Upping Usage Cap to 300GB, But Also Tests New Overlimit Fees

Comcast today announced it was incrementally increasing its 250GB usage cap by 50 additional gigabytes per month as part of a new trial, the first allowance increase since the company started the cap in 2008.

But before so-called “heavy users” celebrate, the company is also announcing it will test overlimit fees for customers who exceed the new 300GB cap.

Cathy Avgiris, Executive Vice President and General Manager, Communications and Data Services, Comcast Cable:

We’ve decided to change our approach and replace our static 250 GB usage threshold with more flexible data usage management approaches that benefit consumers and support innovation and that will continue to ensure that all of our customers enjoy the best possible Internet experience over our high-speed data service. In the next few months, therefore, we are going to trial improved data usage management approaches comparable to plans that others in the market are using that will provide customers with more choice and flexibility than our current policy. We’ll be piloting at least two approaches in different markets, and we’ll provide additional details on these trials as they launch. But we can give everyone an overview today.

The first new approach will offer multi-tier usage allowances that incrementally increase usage allotments for each tier of high-speed data service from the current threshold. Thus, we’d start with a 300 GB usage allotment for our Internet Essentials, Economy, and Performance Tiers, and then we would have increasing data allotments for each successive tier of high speed data service (e.g., Blast and Extreme). The very few customers who use more data at each tier can buy additional gigabytes in increments/blocks (e.g., $10 for 50 GB).

The second new approach will increase our data usage thresholds for all tiers to 300 GB per month and also offer additional gigabytes in increments/blocks (e.g., $10 per 50 GB).

In both approaches, we’ll be increasing the initial data usage threshold for our customers from today’s 250 GB per month to at least 300 GB per month.

In markets where we are not trialing a new data usage management approach, we will suspend enforcement of our current usage cap as we transition to a new data usage management approach, although we will continue to contact the very small number of excessive users about their usage.

Tell Comcast to drop the padlock on your broadband connection altogether.

The change comes at the same time Comcast is under fire for allegedly giving preferential, cap-free treatment to its own video content through an Xbox video game console app.

Comcast has followed AT&T’s pricing, testing a new overlimit fee of $10 for each 50GB increment customers exceed their allowance.  While not outrageous on a per gigabyte basis, the minimum charge of $10 is steep, especially considering Comcast pays only pennies per gigabyte to move traffic.

Stop the Cap! urges Comcast customers to use the occasion to demand the company suspend its unnecessary and arbitrary usage cap altogether.

The best approach for consumers is the one Comcast plans for markets not subject to a trial of their latest Internet Overcharging schemes. Namely, leaving the overwhelming majority of Comcast customers alone while informally reaching out to the tiny minority of customers the company feels are consuming data at levels that create significant problems for other customers on their network. With Comcast’s near-universal adoption of DOCSIS 3 technology, those problems are rarer than ever.

Search This Site:

Contributions:

Recent Comments:

Your Account:

Stop the Cap!