Home » Search Results for "samknows":

Keeping Providers Honest: FCC to Announce New Crowdsourced Mobile Broadband Speed Test

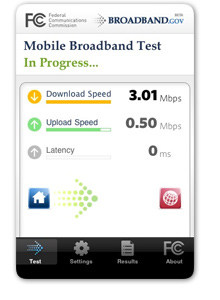
fcc_appAre you getting the mobile broadband speeds your provider advertises for its whiz-bang 4G network? How do you know which carrier really delivers?

The Federal Communications Commission is hoping you can help them find out with a free Android app to be unveiled on Thursday.

The FCC has successfully used volunteer crowdsourcing before to keep wired Internet Service Providers honest through its “TestMyISP” speed measurement project for home broadband connections. When the first results were announced, an embarrassingly bad rating for Cablevision forced the cable company to quickly beef up its broadband infrastructure to match the speeds it promised customers.

Now the FCC’s new chairman Tom Wheeler hopes a similar effort will help the federal agency understand whether the promises wireless carriers make to customers are actually being kept.

With wireless broadband gaining in prominence, the FCC wants to do a better job monitoring a service most Americans use in some form while on-the-go. If providers like AT&T and Verizon Wireless are caught dramatically underperforming in coverage and speed, the agency may take that into account as part of its mission of regulatory oversight.

Consumers will also benefit from having an unbiased source that can offer regular analyses on the speed and performance of each carrier — useful information to have before being locked into a two-year contract.

Verizon, AT&T, T-Mobile, and Sprint are among the carriers agreeing to take part in the speed test project.

The FCC Speed Test app will initially be available for Android smartphones. There are no details about the release date of an Apple iOS version of the app, but the FCC’s Mobile Broadband Speed Test home page shows links (not yet active) for both versions of the app.

America’s Fastest-Rated ISPs Bring No Surprises: Fiber Wins, Telco DSL, U-verse Loses

Phillip Dampier October 1, 2012 Broadband Speed, Competition, Consumer News Comments Off on America’s Fastest-Rated ISPs Bring No Surprises: Fiber Wins, Telco DSL, U-verse Loses

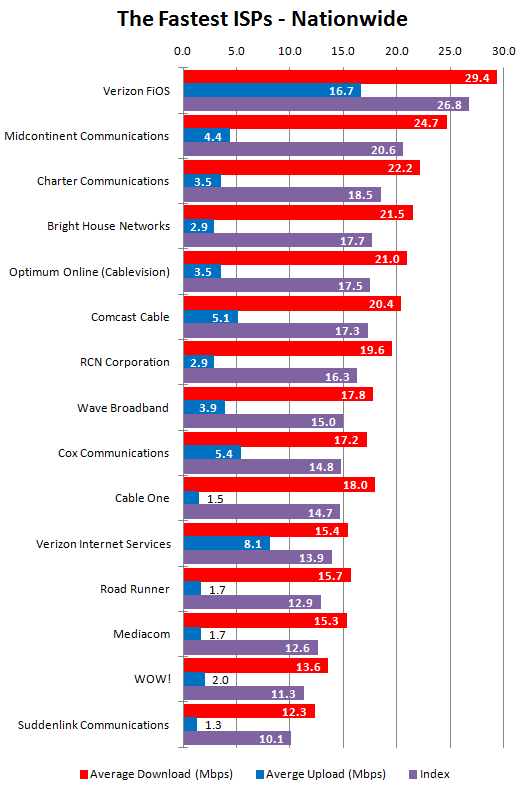
PC Magazine has declared fiber to the home service America’s fastest broadband technology, and among larger providers, Verizon’s FiOS once again took top honors for delivering the fastest and most consistent broadband speeds.

Over the past nine months, the magazine’s readers have been conducting regular speed tests using their personal broadband connections. The magazine found fiber optics remains the best current technology for delivering cutting-edge broadband service, with an average speed rating for FiOS reaching 29.4/16.7Mbps. Since PC Magazine readers were subscribed to various speed tiers while conducting the tests, the magazine’s ratings do not measure the fastest possible speeds on offer from different providers. Verizon’s most-popular service bundle includes 15/5Mbps service, heavily weighting Verizon’s speed rating which is capable of even faster speeds with their 50-300Mbps premium service tiers. But on average, consistently fast speeds kept them in the top spot.

Cable broadband technology was the second-best choice, depending on how cable operators implement it. Cable companies depend on a singl, shared broadband pipeline in each neighborhood. DOCSIS 3 upgrades allow a cable operator to vastly expand that pipeline by “bonding” several channels together to increase the maximum bandwidth. Cable operators that combine the latest technology with the smallest number of customers sharing a connection do the best.

Midcontinent Communications (better known by customers as Midco), achieved first place nationwide. The company, which serves customers in Minnesota, the Dakotas, and Wisconsin, took top honors with an average speed of 24.7/4.4Mbps — the best of any cable operator.

Ratings sometimes show the level of investment made by cable operators in their network. A sudden boost in average speeds is a sure sign a cable operator is rolling out network upgrades. A speed decline can expose a cable company trying to oversell an already constrained network. Charter Cable, which has routinely gotten poor ratings in Consumer Reports’ rankings, showed dramatic improvement in PC Magazine’s ratings, achieving third place with an average speed increase from 15Mbps to 18.5Mbps. But while the added speed is nice, the company’s usage caps are not. Conversely, WOW!, which achieved top scores in Consumer Reports’ ratings, scored towards the bottom of PC Magazine’s tests.

Comcast, which last year trumpeted its high rankings in controversial ads claiming to deliver the fastest broadband in the nation has now been overrun by both Midco and Charter. Comcast Xfinity is now in sixth place, hardly the fodder for any future ad campaign.

Cox Cable actually lost ground since last year, with average speed now down to 14.8Mbps. The bottom four: Time Warner Cable, Mediacom, WOW!, and Suddenlink — are all hampered by slow upload speeds and more anemic “take-rates” on higher speed broadband plans with the speeds on offer. With fewer premium speed customers, average speed ratings take a hit from the larger proportion of customers sticking with standard service.

Phone companies barely appeared in the magazine’s top ratings. AT&T’s U-verse could not even make the top-15. While 25Mbps was adequate when U-verse was first deployed, the broadband speed race has quickly overshadowed the company’s fiber to the neighborhood service, which still relies on home phone lines and antiquated copper infrastructure in the immediate neighborhood.

Phone companies still offering traditional ADSL on almost all-copper networks turned in even more dismal results — most too low to rate. Only Frontier’s adopted FiOS network kept them in the rankings in the overall broadband “slow zone” in the Pacific Northwest, along with CenturyLink’s acquired ADSL2+ and bonded DSL networks built by Qwest.

ISPs that perform poorly typically criticize the methodology of voluntary speed tests as the basis for speed and performance ranking. Most criticize the apparent lack of consistency, random sampling, the possibility rankings may be weighted in certain geographic areas, and may mix a disproportionate number of customers with standard or premium level speeds to unfairly boost or diminish average speed rankings. But overall, PC Magazine’s rankings show some technologies superior to others. If a customer has a choice, finding a fiber to the home provider is likely to provide an improvement over what the cable company offers, but the differences between phone company DSL and cable broadband are even starker.

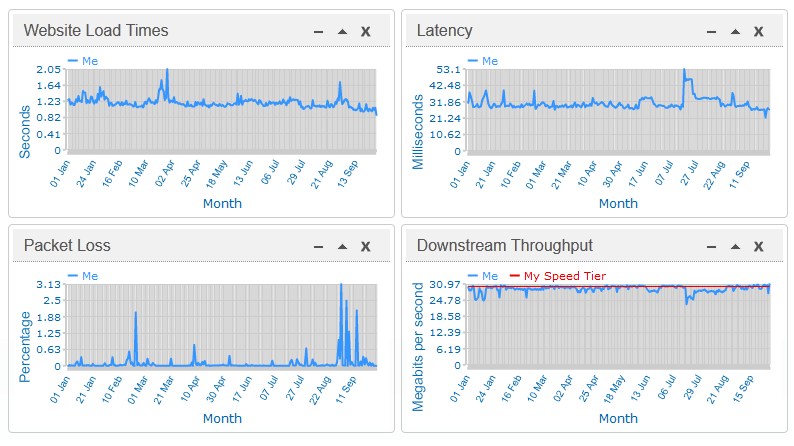
The FCC speed test program, conducted by SamKnows, takes more regular snapshots of broadband quality from volunteer panelists. Your editor’s home broadband connection from Time Warner Cable is profiled above, showing results from January-September 2012

Latest FCC Report on Broadband Speeds: Good for Verizon, Cablevision; Bad for Frontier

The Federal Communications Commission’s July report on America’s broadband speeds shows virtually every major national provider, with the exception of Frontier Communications, made significant improvements in delivering the broadband service and speeds they advertise to customers.

Utilizing thousands of volunteer testers agreeing to host a router that performs automated speed tests and other sampling measurements (full disclosure: your editor is a volunteer participant), the FCC speed measurement program is one of the most comprehensive independent broadband assessments in the country.

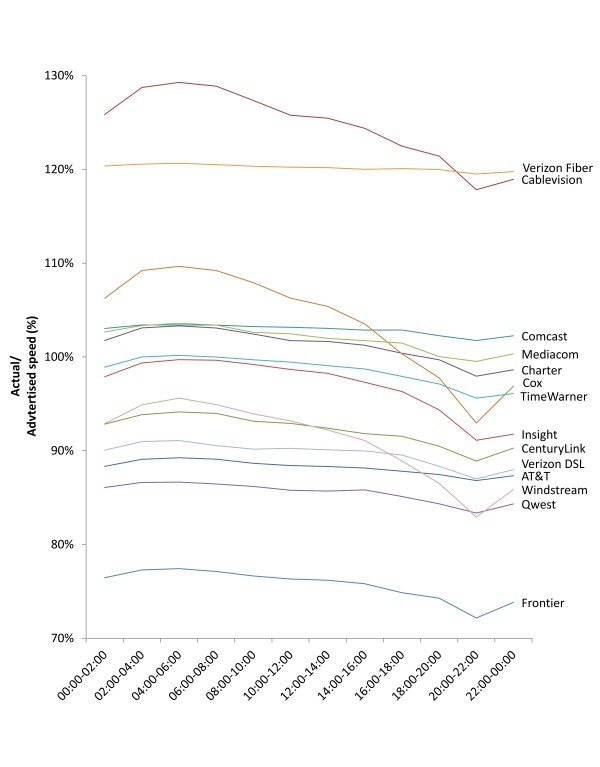
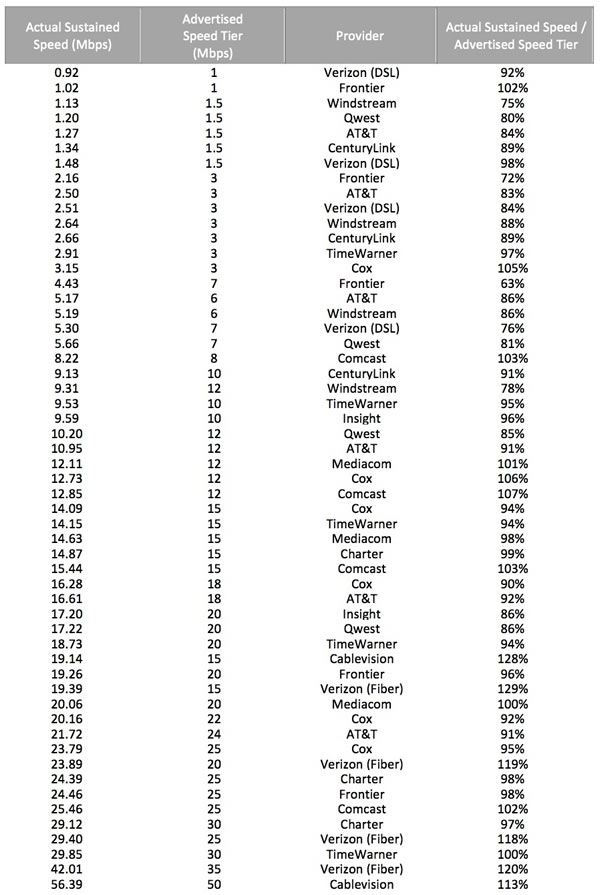
Hourly Sustained Download Speeds as a Percentage of Advertised, by Provider—April 2012 Test Data

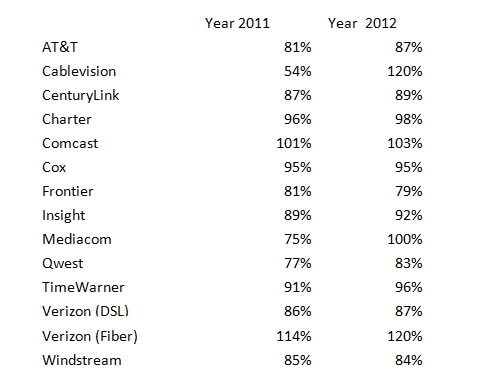
The FCC found Cablevision’s improvements last year paid off handsomely for the company, which now effectively ties with Verizon Communication’s FiOS fiber-to-the-home service for delivering promised speeds during peak usage times. The cable operator was embarrassed in 2011 when the FCC found Cablevision broadband customers’ speeds plummeted during Internet use prime time. Those problems have since been corrected with infrastructure upgrades — particularly important for a cable operator that features near-ubiquitous competition from Verizon’s fiber network.

“This report demonstrates our commitment to delivering more than 100 percent of the speeds we advertise to our broadband customers – over the entire day and during peak hours – in addition to free access to the nation’s largest Wi-Fi network and other valuable product features and enhancements,” said Amalia O’Sullivan, Cablevision’s vice president of broadband operations.

Verizon also blew its own horn in a press statement released this afternoon.

“Verizon’s FiOS service continues to demonstrate its mastery of broadband speed, reliability and consistency for consumers as represented in today’s FCC-SamKnows residential broadband report,” said Mike Ritter, chief marketing officer for Verizon’s consumer and mass market business unit. “The FCC’s findings reaffirm the results from the 2011 report, which found that FiOS provides blazing-fast and sustained upstream and downstream speeds even during peak usage periods. This year’s results also show once again that FiOS Internet customers are receiving speeds that meet or exceed those we advertise, adding even more value to the customer experience.”

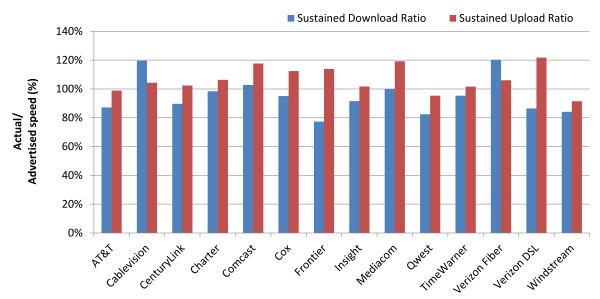
Average Peak Period Sustained Download and Upload Speeds as a Percentage of Advertised, by Provider—April 2012 Test Data

Cable operators’ investments in DOCSIS 3 technology also allowed their broadband networks to perform well even as broadband usage continues to grow. Comcast delivered 103% of promised speeds during peak usage, Time Warner Cable – 96%, and Cox – 95%.

Just one nationwide provider lost ground in the last year — Frontier Communications, whose DSL service has grown more congested than ever, with insufficient investment in network upgrades apparent by the company’s dead-last results.

Frontier managed 81% of promised speeds in 2011, partly thanks to its inherited fiber to the home network. This year, it managed only 79%.

Frontier performed adequately for customers choosing its lowest 1Mbps speed tier. It also performed well in areas where its fiber network can sustain much faster speeds. The biggest problems show up for Frontier’s DSL customers buying service at speeds of 3-10Mbps. At peak times, network congestion brings those speeds down.

On average, the FCC found fiber to the home service delivers the best broadband performance, followed by cable broadband, and then telephone company DSL. Five ISPs now routinely deliver nearly one hundred percent or greater of the speed advertised to the consumer even during time periods when bandwidth demand is at its peak. In the August 2011 Report, only two ISPs met this level of performance. In 2011, the average ISP delivered 87 percent of advertised download speed during peak usage periods; in 2012, that jumped to 96 percent. In other words, consumers today are experiencing performance more closely aligned with what is advertised than they experienced one year ago.

The FCC report also found that outlier performers in the 2011 study, with the exception of Frontier, worked hard to make their differences in performance disappear. Last year, the standard deviation from promised broadband speeds was 14.4 percent. This year it is 12.2 percent.

Peak Period Sustained Download Performance, by Provider—April 2012 Test Data

The FCC also found consumers are gravitating towards higher-priced, higher-speed broadband service. Last year’s average broadband speed tier was 11.1Mbps. This year it is 14.3Mbps, almost 30% higher. Along with faster speeds comes more usage. Customers paying for more speed expect to use their broadband connections more, and the FCC found they do.

Overall, the FCC was encouraged to see broadband speed tiers on the increase, some to 100Mbps or higher.

Highlights from the report:

  • Actual versus advertised speeds. The August 2011 Report showed that the ISPs included in the Report were, on average, delivering 87 percent of advertised speeds during the peak consumer usage hours of weekdays from 7:00 pm to 11:00 pm local time. The July 2012 Report finds that ISP performance has improved overall, with ISPs delivering on average 96 percent of advertised speeds during peak intervals, and with five ISPs routinely meeting or exceeding advertised rates.
  • Sustained download speeds as a percentage of advertised speeds. The average actual sustained download speed during the peak period was calculated as a percentage of the ISP’s advertised speed. This calculation was done for each speed tier offered by each ISP.
    • Results by technology:
      • On average, during peak periods DSL-based services delivered download speeds that were 84 percent of advertised speeds, cable-based services delivered 99 percent of advertised speeds, and fiber-to-the-home services delivered 117 percent of advertised speeds. This compared with 2011 results showing performance levels of 82 percent for DSL, 93 percent for cable, and 114 percent for fiber. All technologies improved in 2012.
      • Peak period speeds decreased from 24-hour average speeds by 0.8 percent for fiber-to-the-home services, 3.4 percent for DSL-based services and 4.1 percent for cable-based services. This compared with 0.4 percent for fiber services, 5.5 percent for DSL services and 7.3 percent for cable services in 2011.
    • Results by ISP:
      • Average peak period download speeds varied from a high of 120 percent of advertised speed to a low of 77 percent of advertised speed. This is a dramatic improvement from last year where these numbers ranged from a high of 114 percent to a low of 54 percent.
      • In 2011, on average, ISPs had a 6 percent decrease in delivered versus advertised download speed between their 24 hour average and their peak period average. In 2012, average performance improved, and there was only a 3 percent decrease in performance between 24 hour and peak averages.
  • Sustained upload speeds as a percentage of advertised speeds. With the exception of one provider, upload speeds during peak periods were 95 percent or better of advertised speeds. On average, across all ISPs, upload speed was 107 percent of advertised speed. While this represents improvement over the 103 percent measured for 2011, upload speeds have not been a limiting factor in performance and most ISPs last year met or exceeded their advertised upload speeds. Upload speeds showed little evidence of congestion with little variance between 24 hour averages and peak period averages.
    • Results by technology: On average, fiber-to-the-home services delivered 106 percent, DSL-based services delivered 103 percent, and cable-based services delivered 110 percent of advertised upload speeds. These compare with figures from 2011 of 112 percent for fiber, 95 percent for DSL, and 108 percent for cable.
    • Results by ISP: Average upload speeds among ISPs ranged from a low of 91 percent of advertised speed to a high of 122 percent of advertised speed. In 2011, this range was from a low of 85 percent to a high of 125 percent.
  • Latency. Latency is the time it takes for a packet of data to travel from one designated point to another in a network, commonly expressed in terms of milliseconds (ms). Latency can be a major controlling factor in overall performance of Internet services. In our tests, latency is defined as the round-trip time from the consumer’s home to the closest server used for speed measurement within the provider’s network. We were not surprised to find latency largely unchanged from last year, as it primarily depends upon factors intrinsic to a specific architecture and is largely outside the scope of improvement if networks are appropriately engineered. In 2012, across all technologies, latency averaged 31 milliseconds (ms), as opposed to 33 ms measured in 2011.
    • During peak periods, latency increased across all technologies by 6.5 percent, which represents a modest drop in performance. In 2011 this figure was 8.7 percent.
      • Results by technology:
        • Latency was lowest in fiber-to-the-home services, and this finding was true across all fiber-to-the-home speed tiers.
        • Fiber-to-the-home services provided 18 ms round-trip latency on average, while cable-based services averaged 26 ms, and DSL-based services averaged 43 ms. This compares to 2011 figures of 17 ms for fiber, 28 ms for cable and 44 ms for DSL.
      • Results by ISP: The highest average round-trip latency for an individual service tier among ISPs was 70.2 ms, while the lowest average latency within a single service tier was 12.6 ms. This compares to last year’s maximum latency of 74.8 ms and minimum of 14.5 ms.
  • Effect of burst speed techniques. Some cable-based services offer burst speed techniques, marketed under names such as “PowerBoost,” which temporarily allocate more bandwidth to a consumer’s service. The effect of burst speed techniques is temporary—it usually lasts less than 15 to 20 seconds—and may be reduced by other broadband activities occurring within the consumer household. Burst speed is not equivalent to sustained speed. Sustained speed is a measure of long-term performance. Activities such as large file transfers, video streaming, and video chat require the transfer of large amounts of information over long periods of time. Sustained speed is a better measure of how well such activities may be supported. However, other activities such as web browsing or gaming often require the transfer of moderate amounts of information in a short interval of time. For example, a transfer of a web page typically begins with a consumer clicking on the page reference and ceases when the page is fully downloaded. Such services may benefit from burst speed techniques, which for a period of seconds will increase the transfer speed. The actual effect of burst speed depends on a number of factors explained more fully below.
    • Burst speed techniques increased short-term download performance by as much as 112 percent during peak periods for some speed tiers. The benefits of burst techniques are most evident at intermediate speeds of around 8 to 15 Mbps and appear to tail off at much higher speeds. This compares to 2011 results with maximum performance increases of approximately 50 percent at rates of 6 to 7 Mbps with tail offs in performance beyond this.
  • Web Browsing, Voice over Internet Protocol (VoIP), and Streaming Video.
    • Web browsing. In specific tests designed to mimic basic web browsing—accessing a series of web pages, but not streaming video or using video chat sites or applications—the total time needed to load a page decreased with higher speeds, but only up to about 10 Mbps. Latency and other factors limited response time starting around speed tiers of 10 Mbps and higher. For these high speed tiers, consumers are unlikely to experience much if any improvement in basic web browsing from increased speed–i.e., moving from a 10 Mbps broadband offering to a 25 Mbps offering. This is comparable to results obtained in 2011 and suggests intrinsic factors (e.g. effects of latency, protocol limitations) limit overall performance at higher speeds. It should be noted that this is from the perspective of a single user with a browser and that higher speeds may provide significant advantages in a multi-user household or where a consumer is using a specific application that may be able to benefit from a higher speed tier.
    • VoIP. VoIP services, which can be used with a data rate as low as 100 kilobits per second (kbps) but require relatively low latency, were adequately supported by all of the service tiers discussed in this Report. However, VoIP quality may suffer during times when household bandwidth is shared by other services. The VoIP measurements utilized for this Report were not designed to detect such effects.
    • Streaming Video. 2012 test results suggest that video streaming will work across all technologies tested, though the quality of the video that can be streamed will depend upon the speed tier. For example, standard definition video is currently commonly transmitted at speeds from 1 Mbps to 2 Mbps. High quality video can demand faster speeds, with full HD (1080p) demanding 5 Mbps or more for a single stream. Consumers should understand the requirements of the streaming video they want to use and ensure that their chosen broadband service tier will meet those requirements, including when multiple members of a household simultaneously want to watch streaming video on separate devices. For the future, video content delivery companies are researching ultra high definition video services (e.g. 4K technology which has a resolution of 12 Megapixels per frame versus present day 1080p High Definition television with a 2 Megapixel resolution), which would require higher transmission speeds.

Year by Year Comparison of Sustained Actual Download Speed as a Percentage of Advertised Speed (2011/2012)


Next Round of FCC Speed Testing Needs More Volunteers: Get a Free Router

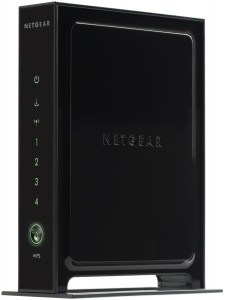
Netgear WNR3500L Wireless-N Router

The Federal Communications Commission’s efforts to measure America’s real broadband speeds needs you.  The federal agency is looking for American volunteers willing to host a wireless router that can conduct occasional background speed tests and report the results to Samknows, the independent company contracted to manage the testing program.  Stop the Cap! has participated in the project for more than eight months and can report the tests are completely un-intrusive and the router has worked well amongst all of our other broadband and networking equipment.

Samknows will supply you with a Netgear WNR3500L Wireless-N router free-of-charge.  We’ve found the router a tad plasticky, but it has performed well with no serious performance issues, especially after the firmware was updated earlier this year.  The router comes pre-configured with the speed and performance testing protocol built right in.  It conducts various automated tests a few times daily — tests that we’ve never found bothersome while using our broadband service.  It reports results back to Samknows, and by extension the FCC. Once a month you will receive an e-mailed “report card” for your particular Internet Service Provider’s performance.

Time Warner Cable has received high marks from our Samknows router here in Brighton, N.Y.  But we know of plenty of cases where volunteers have successfully been able to call out their providers with less-than-stellar performance results.  Just ask Cablevision, whose dismal performance in the first broadband report from the FCC exposed an obviously oversold broadband network.  Cablevision hurried out press releases trying to deflect blame, but we suspect they are also quietly upgrading their network to ensure no repeat performance of their failing grade in the next report.

The program is a great way to do your part to fight for better broadband in the United States, and you walk away with a free wireless router when it’s all over.

There are some requirements to participate:

  • You have a fixed line broadband Internet connection to your residence.
  • You use a standalone device to connect to your broadband service (a cable or DSL modem or router combination with modem built-in).
  • You have a stable broadband connection (i.e. it doesn’t disconnect frequently). Note that this is just referring to the connection – not the speed.
  • You are not a heavy downloader. Our tests can only run when your line below a certain traffic threshold, therefore we would not be able to run any tests if your line is in constant use.
  • You have a spare power socket near your existing router (or wherever you plan to connect the unit. Keep in mind that a network cable must run between the unit and your router though! We supply a 1m cable).
  • You need to be on one of the ISPs that we’re measuring.
  • You are not an employee or a family member of an employee of one of the ISPs being monitored.

With respect to being a “heavy downloader,” what Samknows really means here is that you are not running peer-to-peer file-sharing software 24/7.  They don’t mind if you spend a lot of time with Netflix or other online services.  If your provider delivers inconsistent service with frequent outages, I’d still apply.  The poor results will be reflected in the FCC report.

Participants also have to broadly agree with certain terms and conditions:

  • Not to unplug the unit or your ISP’s router unless away for an extended period of time.
  • Not attempt to reverse engineer or alter the unit.
  • To notify Samknows if and when you choose to change ISPs.
  • To return the unit to Samknows should you no longer wish to be involved (Samknows to pay reasonable postage costs).
  • To connect the unit in the way described in the documentation.
  • To keep Samknows updated with valid contact details (i.e. email and postal address).

In our experience, we can offer some clarifications here:

  1. They don’t care if you unplug equipment during a storm or for other short-term periods;
  2. They do allow you to run the equipment in “bridge mode,” meaning you can still rely on your primary router, leaving the Netgear Samknows router as an adjunct to your home network;
  3. You are allowed to apply firmware upgrades, as available, so long as they retain the performance testing protocol.

Applying is easy enough.  Simply complete the online form and Samknows will contact you when the next round of routers is prepared to ship.  It typically takes several weeks between rounds, so don’t expect an immediate reply.  The router will be sent to you through UPS or FedEx, no signature required.  The testing program is scheduled to last up to three years.

America Falls in Broadband Rankings: Now in 12th Place for Wired Broadband, Providers in Denial

America’s broadband ranking has fallen once again, mostly at the expense of other countries who have accelerated service and speed upgrades above and beyond what is available in the United States.  That is the conclusion one can reach after reviewing the Federal Communications Commission’s second annual broadband report, delivered to Congress to fulfill obligations under the Broadband Data Improvement Act.

Through a combination of data from OECD broadband rankings and actual speed test results collected by the Commission, the FCC report notes American cities are at risk of losing the broadband speed race.

“This report compares data on average actual download speeds reported by a sample of consumers in a number of U.S. and foreign cities and finds that some large European and Asian cities exhibit a significant edge over comparable U.S. cities in reported download speeds, though reported speeds for some other international cities are roughly comparable to speeds in many U.S. cities,” the report concludes.

“The best currently available data set comparing the United States to other countries appears to be from the OECD, which collects data on various broadband deployment, adoption, and usage metrics and publishes rankings of its member countries. The OECD’s deployment data ranks countries based on particular technologies, rather than overall coverage. The U.S. ranking in these surveys ranges from 27th out of 30 in DSL coverage to 1st out of 28 in cable modem coverage.  The U.S. ranks 6th out of 16 in fiber-to-the-home (FTTH) coverage and 8th out of 29 in 3G mobile wireless coverage.”
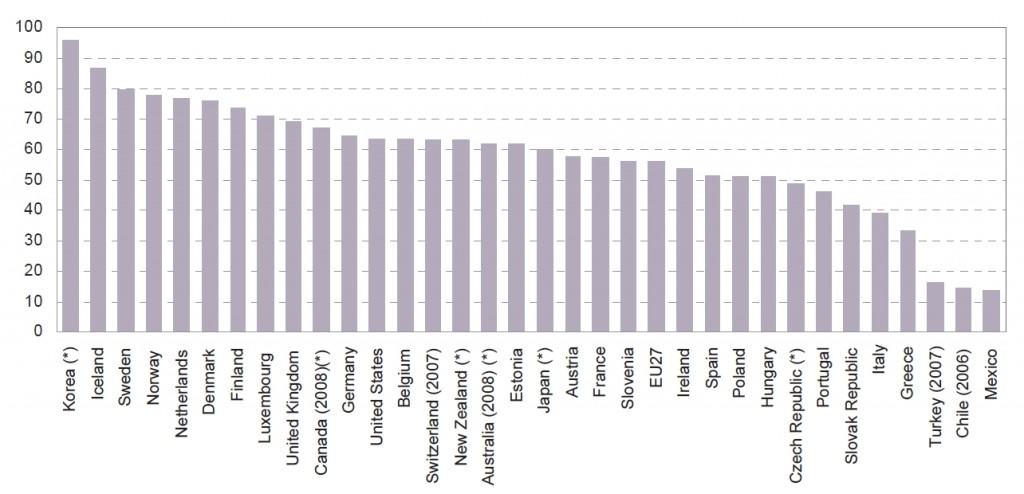
Broadband Rankings (click to enlarge)

Most of the countries accelerating far beyond the United States in broadband speed and quality are in Asia and Europe, and many are upgrading their networks to fiber-based broadband.  As these fiber networks come online, the United States can be expected to fall further behind.

The cable industry lobby attacked the report's findings.

Just like last year, the Internet Service Providers turning in poor grades are rejecting the report’s conclusions.

“While the Commission’s headline proclaims that 20 million Americans are denied access to broadband, by that measure private investment has fueled the build-out of broadband networks to nearly 300 million consumers and is responsible for the jobs that flow from that investment,” said Michael Powell, president and chief executive of the National Cable and Telecommunications Association.  Powell used to oversee the FCC as chairman during the first term of the Bush Administration.

Another trade association with ties to the telecom industry, USTelecom, attacked the findings noting most Americans think their existing broadband service is good enough.

Walter McCormick Jr., USTelecom CEO, noted the FCC’s own report found that 95 percent of Americans have access to fixed broadband and 93 percent are happy with their service.

...so did USTelecom, another industry funded group

But McCormick says nothing about the speeds those customers receive, a bone of contention with the Commission.  As part of this year’s report, the FCC is increasingly relying on its own verifiable data about broadband speeds, collected through its SamKnows broadband speed test project.  The Commission has repeatedly noted that broadband speeds marketed by ISPs do not always match the actual speeds customers receive.

Speed tests comparing broadband performance in comparably sized cities found some sizable differences.

The data suggest that mean actual download speeds in some European and Asian cities are substantially higher than in comparably sized U.S. cities (e.g., 24.8 megabits per second (Mbps) in Paris and 35.8 Mbps in Seoul versus 6.9 Mbps in San Francisco, 9.4 Mbps in Chicago, and 9.9 Mbps in Phoenix). Some of the U.S. cities in our sample have higher speeds than some foreign cities (e.g., Chicago with 9.39 Mbps versus Rome with 5.6 Mbps).

The most significant reason for the disparity in speed is the technology used in each respective area.  Fiber to the home service traditionally delivers the fastest broadband speeds.  Cable broadband technology, common in the United States but less so abroad, is responsible for a great deal of speed increases in the United States.  Telephone company DSL and wireless are responsible for some of the slowest speeds, with rural DSL service commonly providing just 1-3Mbps service.  Many European cities still relying on DSL technology have upgraded to bonded DSL, ADSL2+, or VDSL service, which can significantly boost speeds.

Unfortunately, the report concludes, the faster the broadband service delivered, the higher the price — often out of proportion with other OECD countries.

Results […] suggest that U.S. stand-alone residential broadband prices are generally “in the middle of prices in OECD countries,” after accounting for speed, terms of service, data caps, and service delivery technology. Similarly, prices in the United States for business stand-alone broadband services were fourteenth out of 30 among the OECD countries. A paper by the Berkman Center for Internet and Society at Harvard University found prices for U.S. broadband with download speeds of around 768 kbps to be “very good” by international standards. However, as download speeds increase, the paper found that U.S. prices become more expensive than most other OECD countries.

Some providers unimpressed by the independent research accused the FCC of using biased and inconsistent research methods.  AT&T, for example, was unhappy with comparisons among U.S. cities and those of comparable size abroad.  They accused the Commission of not using “a well-defined or consistent methodology for choosing the ‘communities’ or offers.”  In fact, several providers suggested the Commission’s pricing comparisons ignored significant, albeit temporary, discounts some new customers receive, as well as discounts for bundled service packages.  Promotional pricing factors are acknowledged by the Commission, but the report notes the findings do attempt to collect real world pricing paid by actual customers.

For consumers in the United States, broadband envy is as close as the next news report highlighting broadband expansion efforts abroad.  Some countries are deploying 1Gbps broadband networks that deliver consistently faster speeds than American providers, at dramatically lower prices and without a usage cap attached.
Search This Site:

Contributions:

Recent Comments:

Your Account:

Stop the Cap!