![]() The National Telecommunications and Information Administration unveiled America’s broadband map early this morning, showing broadband availability, speeds, and coverage areas across all 50 states.
The National Telecommunications and Information Administration unveiled America’s broadband map early this morning, showing broadband availability, speeds, and coverage areas across all 50 states.
“A state-of-the-art communications infrastructure is essential to America’s competitiveness in the global digital economy,” said Acting Commerce Deputy Secretary Rebecca Blank. “But as Congress recognized, we need better data on America’s broadband Internet capabilities in order to improve them. The National Broadband Map, along with today’s broadband Internet usage study, will inform efforts to enhance broadband Internet access and adoption — spurring greater innovation, economic opportunities, and advancements in health care, education, and public safety.”
The map, searchable by street address or zip code, delivers data largely volunteered by service providers themselves. Some of the data, particularly for broadband speeds, represent best-case scenarios, not actual results. Regardless, looking at the nation as a whole, there are some dramatic gaps in coverage. Large areas west of the Mississippi are without broadband, which can be understandable in the sparsely populated region. To the east, the biggest problem by far as in the Appalachians, especially in West Virginia, western Virginia, and the western Carolinas. West Virginia in particular stands out as the state with the least amount of coverage in the east, perhaps only rivaled by Maine. In the southern U.S., Alabama, Mississippi, Louisiana, and northern Florida are problem areas. East Texas outside of major cities is as well. In rural areas, the coverage map fills in the most when rural wireless mobile providers are introduced, but their broadband plans are hardly suitable as a replacement for wired, unlimited access service.
“The National Broadband Map shows there are still too many people and community institutions lacking the level of broadband service needed to fully participate in the Internet economy. We are pleased to see the increase in broadband adoption last year, particularly in light of the difficult economic environment, but a digital divide remains,” said Assistant Secretary for Communications and Information and NTIA Administrator Lawrence E. Strickling. “Through NTIA’s Broadband Technology Opportunities Program, digital literacy activities, and other initiatives, including the tools we are releasing today, the Obama Administration is working to address these challenges.”
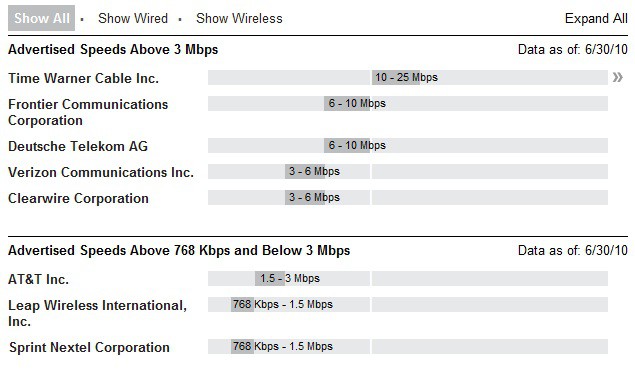
Reviewing the map for Stop the Cap!‘s headquarters — Rochester, N.Y., shows a correct list of providers, but the data about their products is more fantasy than reality:
 Time Warner Cable does not deliver 25/1.5Mbps service to residential customers in Rochester at this time, but its PowerBoost temporary speed gimmick might, for around 30 seconds. Currently, Time Warner Cable maxes out at 15/1Mbps in the Rochester area;
- Frontier’s claim of 10Mbps is a theoretical maximum. Most DSL customers don’t come close. In our area (Brighton, N.Y.) Frontier couldn’t deliver more than 3.1Mbps.
- Wireless carrier data is simply wrong. Sprint-Nextel is beaten down to a maximum 1.5Mbps, despite the arrival of its 4G network, which can manage better than that. Verizon’s 3-6Mbps service is in their dreams, considering this data came from last June — before the introduction of LTE service in Rochester. Clearwire is also guilty of boasting speeds they will never deliver on their increasingly throttled network.
The NTIA touts their map will be verifiable using “crowdsourcing,” but we found visitors are only able to confirm if a provider serves an area, but not how well and at what speeds.
Price data is also missing. Strickling blames that on fast-changing industry practices. We blame it on the fact providers refused to disclose that information, along with more specific details about their broadband networks. Large providers claimed releasing proprietary, confidential business information could harm them competitively.
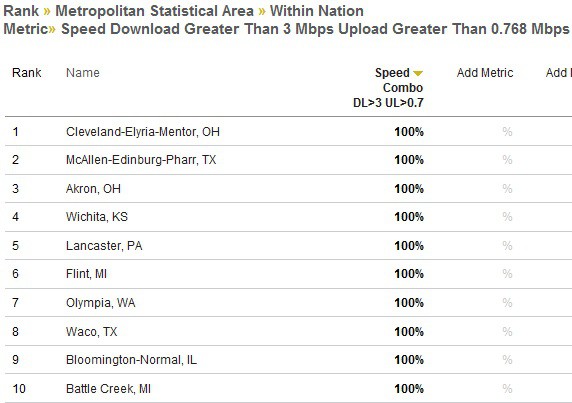
Another glaring example of questionable accuracy is the compelled-to-report top and bottom 10 cities in the country for service. According to the NTIA, America’s number one city for broadband availability at speeds greater than 3Mbps is… Cleveland, Ohio.
Cleveland?
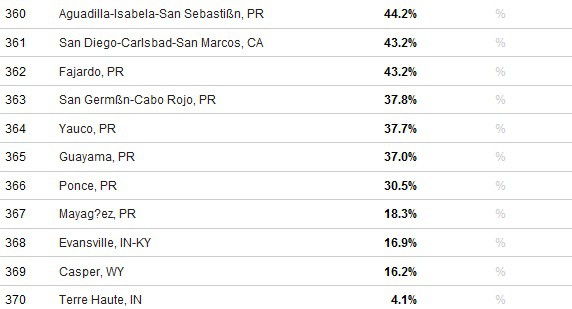
The worst? Terre Haute, Indiana.
Really?


 Subscribe


I checked out the map for myself to see what it showed up for my area. For the most part, it seems to be rather accurate, except in a few places where I know, for example DSL cannot be available. I noticed too, that the map does not show DOCSIS 3.0 cable being available in this area despite it being online for several months now. Regular cable service is accurate. What does irk me off though is the fact that the information for Fiber To the End User seems to be inaccurate once you leave the areas that have FiOS… Read more »
That site is worthless with the so called provided data. For my location, they have AT&T’s WiMax listed, but no prices. They also have the local Cable company offering capped internet plans of 40GB and above but also no prices and their speeds are incorrected, showing 10-25Mbit, their service actually starts at a megabit and goes up per plan, none are 10Mbit. Best of all the local Telephone company offering DSL which has been in business before any of the above companies, isn’t even listed. Either way, this is a huge waste of time, money, and effort. Private databases put… Read more »
We have AT&T, on Speedtest.net ours is 1.18mbps! Up, .018 DOWN!!!! It’s absolutely amazing how much we pay for this sub par service.